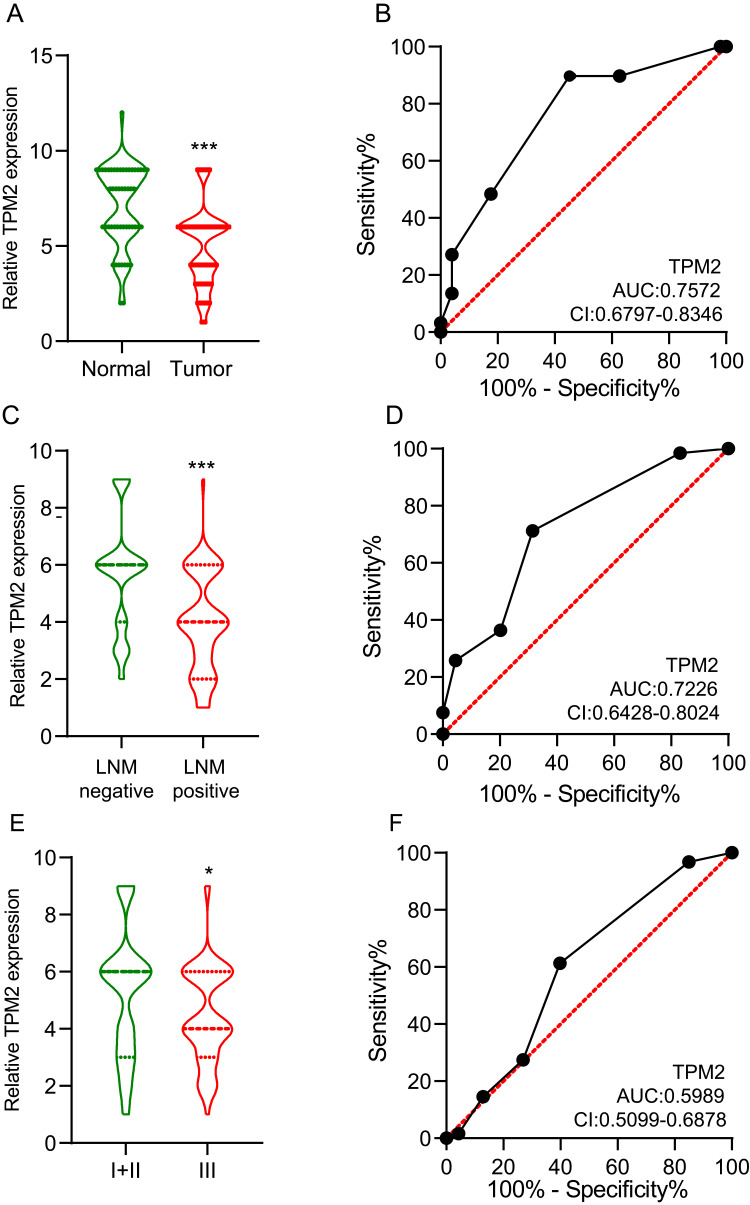
Figure 3.
The expression of TPM2 in breast cancer was evaluated by immunohistochemical staining and grading.(A)The expression level of TPM2 in breast cancer tissues was significantly lower than that in normal breast tissues. (*** p<0.001).(A)ROC curve of TPM2 in normal breast tissues and breast cancers. AUC value of TPM2 in the diagnostic value of breast cancer was up to 0.7572 (95% CI 0.6797–0.8346, P <0.0001). (AUC, area under the curves; CI, Confidence Interval).(B)The expression of TPM2 was associated with lymph node metastases. (*** p<0.001).(C)ROC curve of TPM2 in predicting lymph node metastasis in breast cancer. The AUC value for TPM2 expression was 0.7226 (95% CI, 0.6428–0.8024, P <0.0001). (AUC, area under the curves; CI, Confidence Interval) (D)The expression of TPM2 was associated with histological grade. (* p<0.05).(F)ROC curve of TPM2 in distinguishing histological grades. The AUC value for TPM2 expression was 0.5989 (95% CI, 0.5099–0.6878, P <0.0001). (AUC, area under the curves; CI, Confidence Interval).

