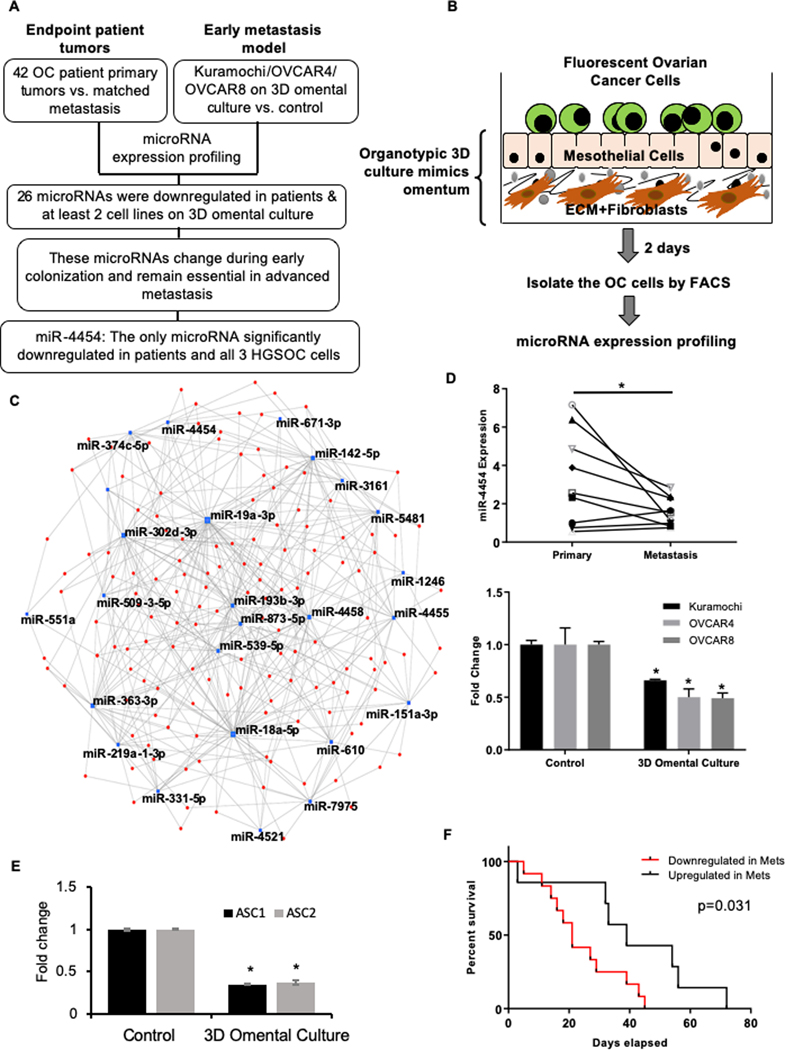
Figure 1. miR-4454 is a key microRNA downregulated in early and advanced OC metastasis.
(A) Overview of the strategy for analysis of primary vs. metastatic OC patient tumor microRNA sequencing data and OC on organotypic 3D omental culture microRNA profiling. RNA isolated from frozen tumor tissue was used for microRNAseq. GFP-tagged OC cells (Kuramochi, OVCAR4 and OVCAR8) were grown on 3D omental culture for 48 h, isolated by FACS, RNA was isolated and microRNA expression was compared to the sham treated controls using NanoString. (B) Schematic representation of the organotypic omental 3D culture model. Mesothelial cells and fibroblasts were isolated from omentum obtained from female donors. The fibroblasts were mixed with type I collagen and seeded in a 10 cm dish. Once attached, they were overlaid with a confluent monolayer of mesothelial cells. Together they mimic the basement membrane and the mesothelium on the surface of the omentum. They were allowed to grow and for 24h so that the secreted factors from the cells could generate a complex microenvironment. Thereafter, GFP labeled OC cells (Kuramochi/OVCAR4/OVCAR8) were seeded on the 3D omentum culture and allowed to grow. After 2 days, the OC cells were separated using fluorescence activated cell sorting (FACS) and used for RNA isolation and microRNA profiling with NanoString nCounter miRNA Expression Assay (800 microRNAs). Controls were seeded directly on the 10 cm culture dishes and were sham treated. (C) microRNA-target interaction networks for the 26 common downregulated microRNAs in patient metastasis and 3D omental culture using miRNet. microRNA hubs are depicted as blue dots and targets as red dots. (D) Top: qRT-PCR validation of miR-4454 in a set of OC patient primary and metastatic tumors. A line connects the expression data for each pair of primary and metastasis. Bottom: qRT-PCR validation of miR-4454 expression in OC cells (Kuramochi, OVCAR4 and OVCAR8) seeded on the 3D omental culture. * p<0.01, Students t-test. (E) OC cells isolated from ascites of 2 OC patients (ASC1 and 2) were grown on 3D omental culture for 48 h, separated by FACS and used for RNA isolation and qRT-PCR for miR-4454 expression. Mean ± SD from 3 independent experiments. * p<0.01, Students t-test. (F) Kaplan–Meier plot comparing patient survival when miR-4454 is upregulated or downregulated 1.5 fold in metastasis (Mets) vs. primary tumors in the OC patient cohort.

