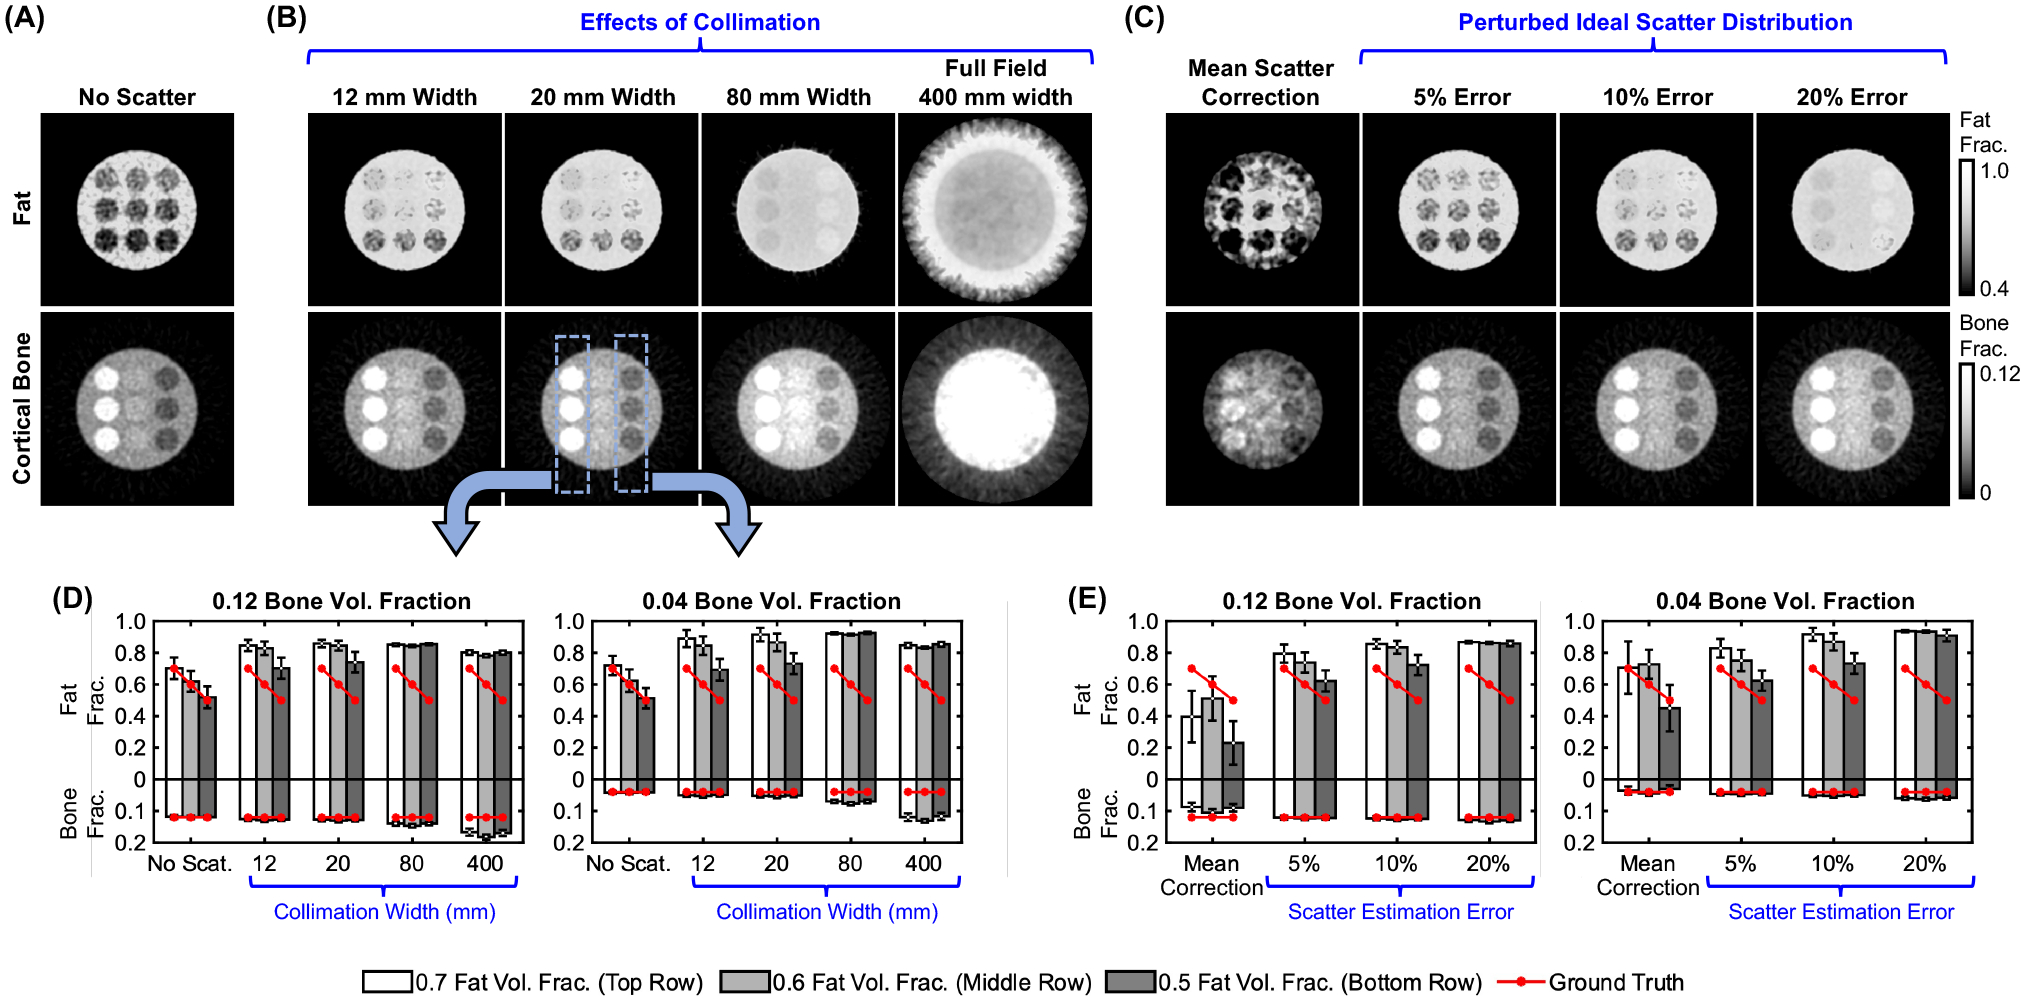
Figure 4.

Adipose and bone concentration maps from (A) scatter-free DE projections, (B) DE projections with scatter for various collimation widths, and (C) full field-of-view DE projections with varied scatter correction error. Mean estimated fat/bone fractions for the leftmost and rightmost columns of inserts (marked on the image) for (D) the collimation study, and (E) the scatter correction study.
