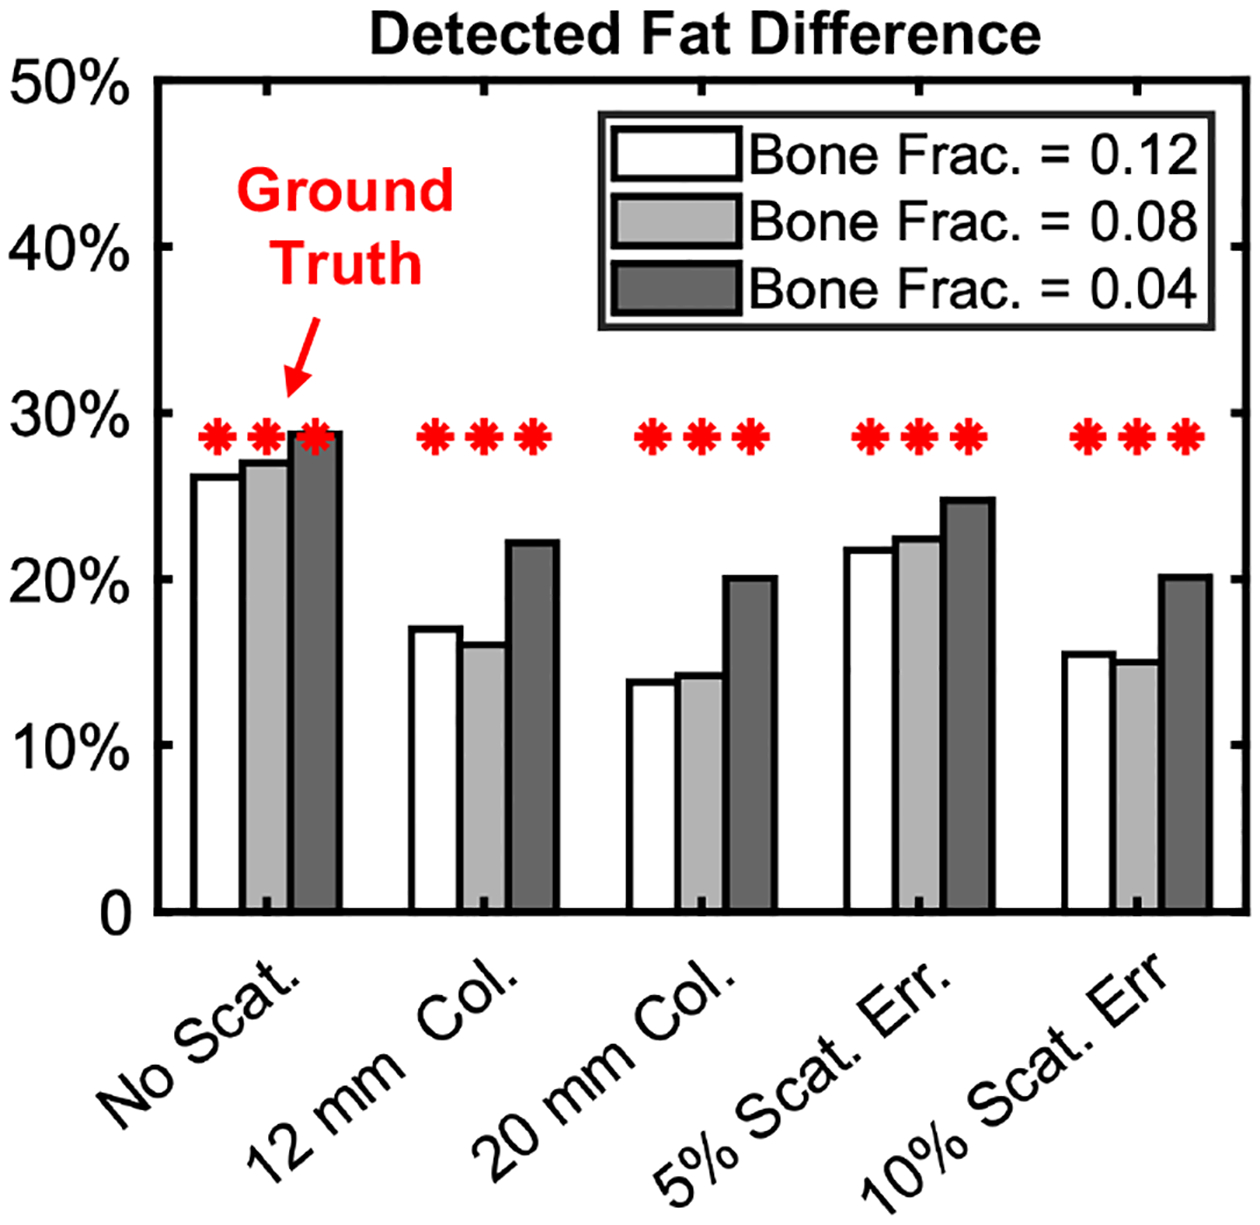
Figure 5.

BME quantification accuracy for DE decompositions of scatter-free data (leftmost set of bars) and for different scatter mitigation strategies. The accuracy is represented by relative decrease in fat concentration measured between the top (true fat frac. = 0.7) and bottom (true fat frac. = 0.5) rows of inserts. Each bar represents one column of inserts.
