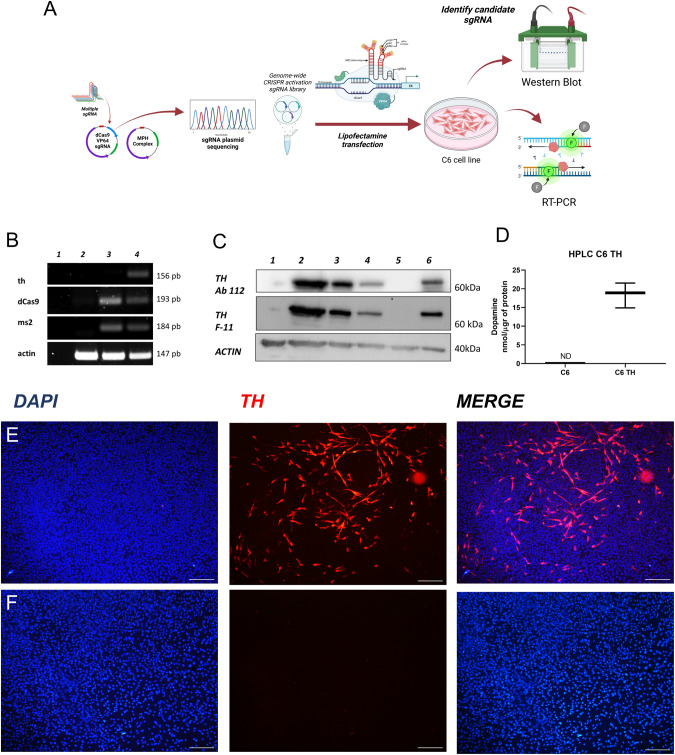
Fig. 1. Tyrosine hydroxylase (Th) expression in C6 cells induced by the SAM CRISPR system.
A Diagram of experimental design for the SAM system. B Detection of th mRNA in C6 TH4 cells, as determined by RT-PCR; lane 1 H2O control, lane 2- C6 cells, lane 3– C6 cells transfected with SAM system and lane 4- C6 cells transfected with the TH4 sgRNA. C Detection of the Th protein, as determined by Western blot analysis; lane 1- C6 cells, lane 2 to 4- C6 TH4 (different samples), lane 5- C6 SAM and lane 6- Rat striatum sample. D Determination of DA in the culture media, as determined by HPLC C6 cells and C6 TH4 cells; independent t-test p = 0.0007, n = 3. E Immunofluorescence for Th in C6 TH4 cells. F Immunofluorescence for Th in C6 cells. Bars represent 20 µm, nuclei revealed with DAPI.

