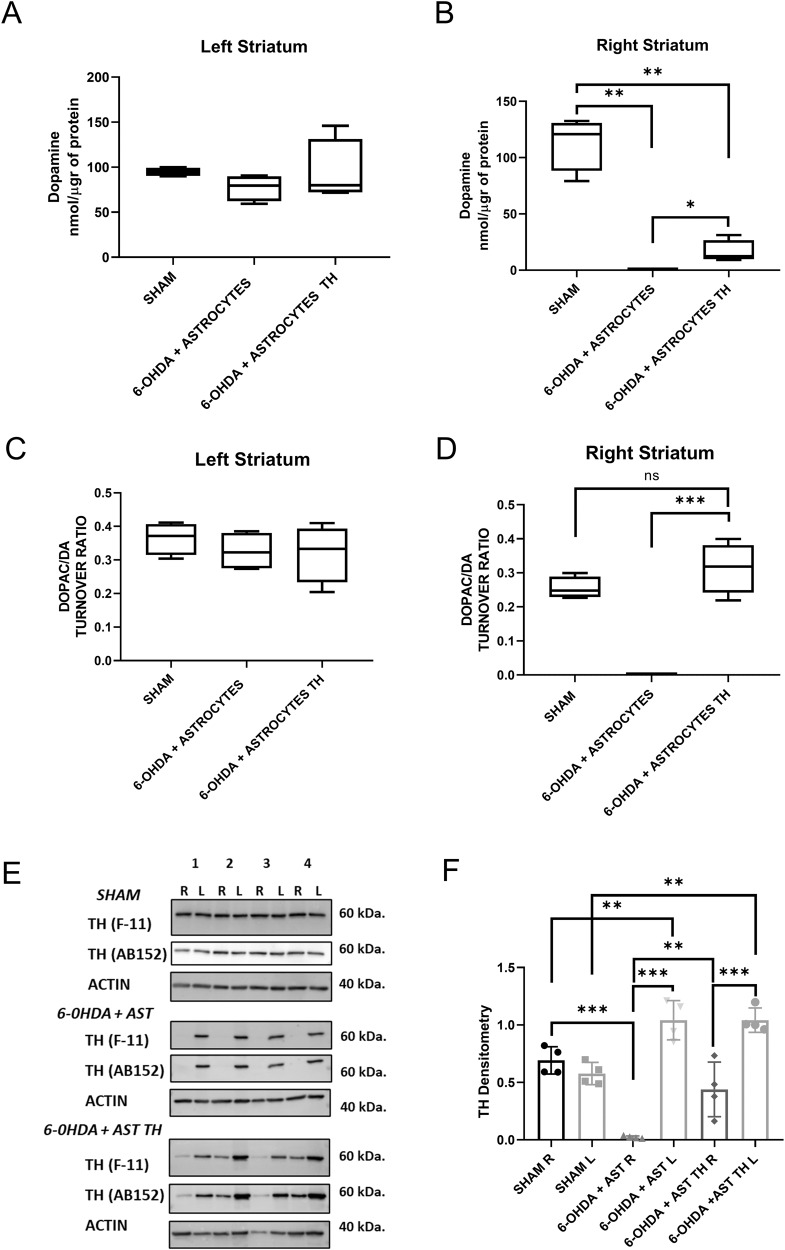
Fig. 4. Levels of DA and DOPAC and expression of in the striata of rats.
A Levels of DA, as determined by HPLC, normalized by µg of protein in the left (intact) and B in the right (lesioned) striatum. Brown–Forsythe ANOVA and Welch´s ANOVA test with a two-stage linear step-up procedure of Benjamini as post hoc. C DOPAC/DA ratio in the left (intact) and D in the right (lesioned) striatum. One-Way ANOVA and Tukey´s multiple comparisons test as post hoc. E Th protein, as determined by Western blot analysis using two different antibodies, and actin as a loading control. F Densitometric analysis of the expression of Th in striata. One-Way ANOVA and Tukey´s multiple comparisons test as post hoc. Bars represent Standard Deviation (SD) *p < 0.05, **p < 0.01, *** is p < 0.001; no significative difference (ns); n = 4.

