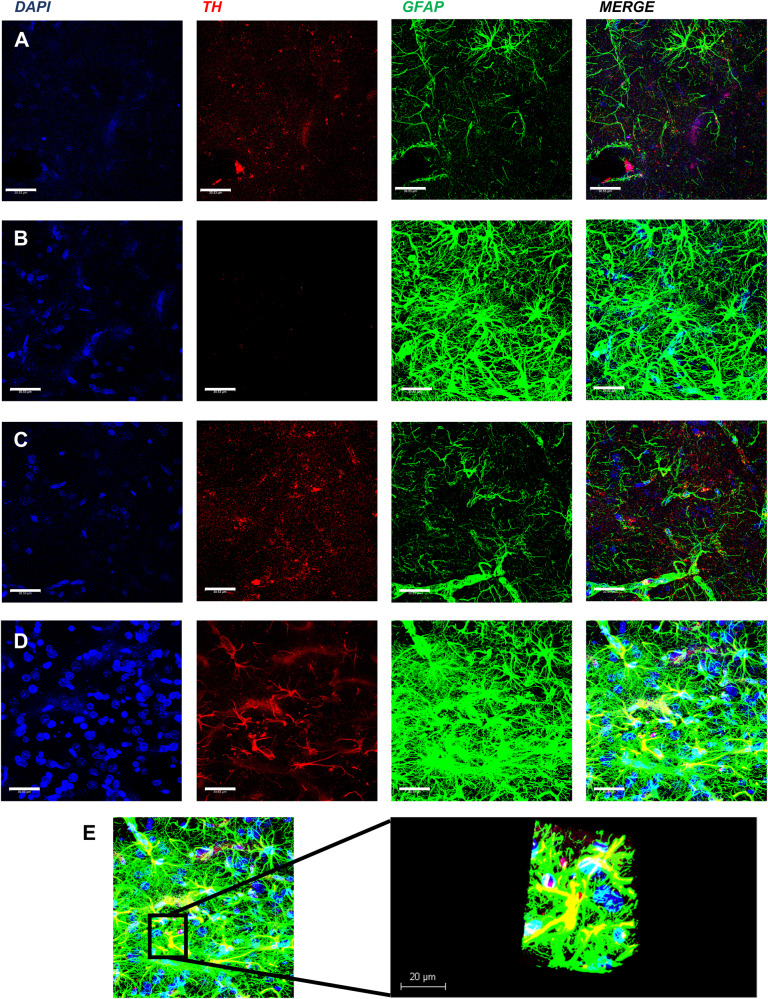
Fig. 5. Expression of Th and GFAP in the striata, as shown by confocal immunofluorescence.
Panels on row A show 6-OHDA + AST left side striatum (intact side), row B shows 6-OHDA + AST right side striatum (lesioned side), row C shows 6-OHDA + AST-TH left side striatum (intact side), and row D shows 6-OHDA + AST-TH right striatum (lesioned side). Th is revealed with a red fluorescent signal, and GFAP with a green fluorescent signal, DAPI (nuclei) in blue. Cells expressing both Th and GFAP show a yellow signal. E 3D reconstruction of Z-slices of an AST-TH implanted in the lesioned striatum. Bars represent 30 µm.

