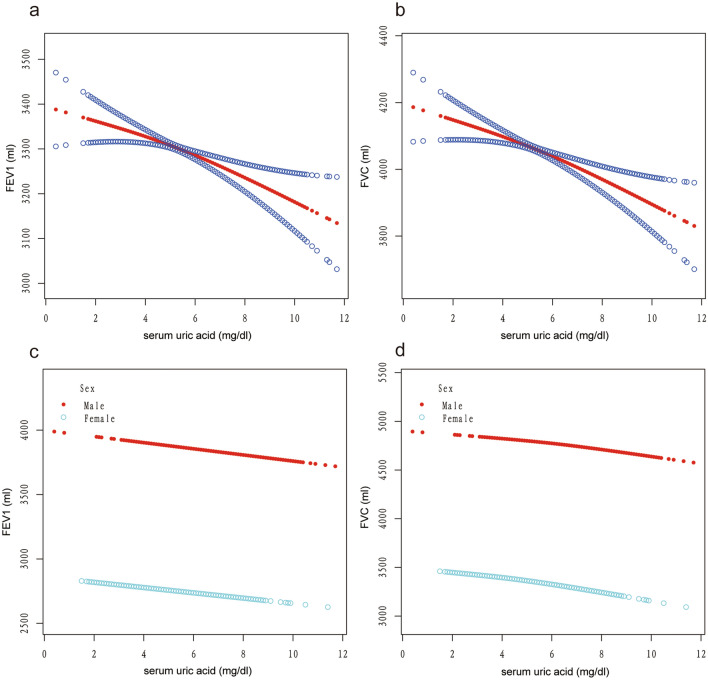
Figure 2.
Correlation between serum uric acid and FEV1 (a and b) and FVC (c and d) in the male and female population. Correlation between serum uric acid and lung function test (FEV1 and FVC) in the total population (a and b) and stratified by gender (c and d). Each black point represents a sample. The area between two blue dotted lined is expressed as a 95% CI. Each point shows the magnitude of the serum uric acid and is connected to form a continuous line. Age, gender, race, income-poverty ratio, BMI, alcohol drinking, smoke, systolic blood pressure, diastolic blood pressure, blood urea nitrogen, total cholesterol, creatinine, calcium, total protein, FeNO and total bilirubin were adjusted.

