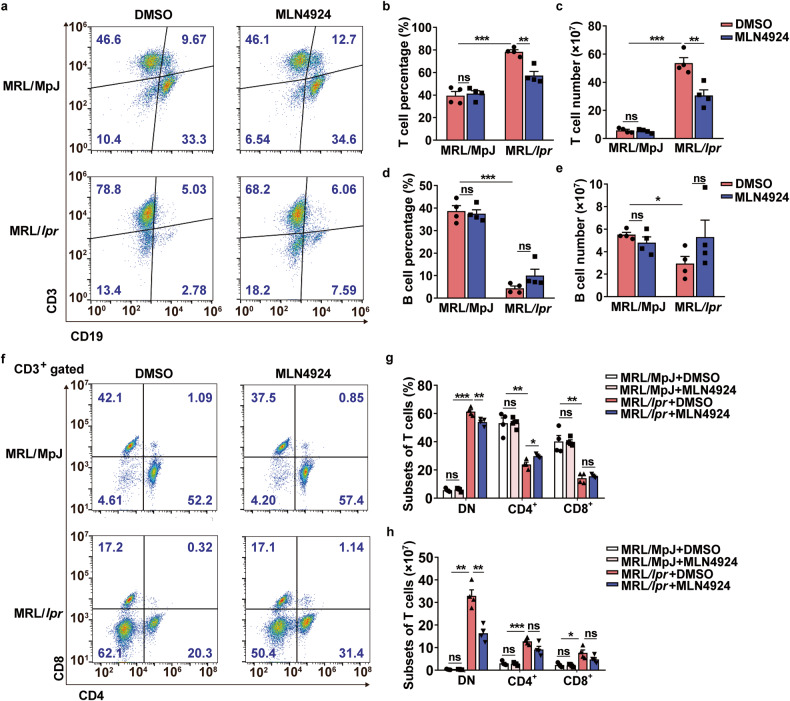
Fig. 2.
Reduced T cell accumulation in MLN4924-treated MRL/lpr mice. a Proportion of T and B cells in spleens was evaluated by flow cytometry. n = 4/group. b–e The percentage and absolute numbers of T cells and B cells were quantified and calculated statistically based on the analysis of flow cytometry. n = 4/group. *P < 0.05, **P < 0.01, ***P < 0.001. f CD3+ T cell subsets in spleens were analyzed using flow cytometry. n = 4/group. g, h Percentage and total count of T cell subsets were quantified and calculated based on the flow cytometric analysis, n = 4/group. *P < 0.05, **P < 0.01, ***P < 0.001

