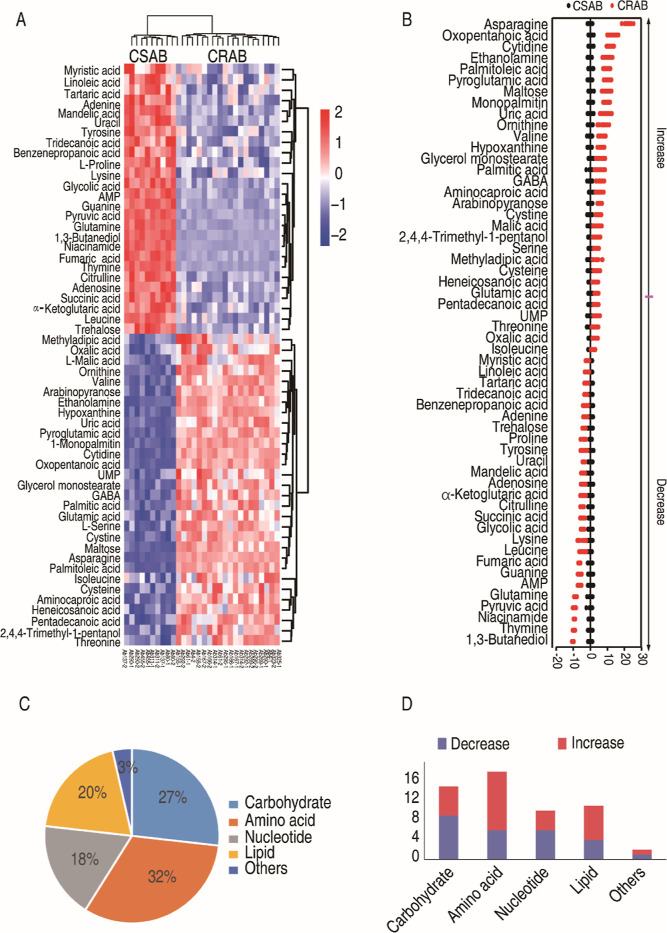
Figure 2.
Differential metabolomes between clinically isolated CSAB and CRAB. (A) Heat maps of the differential metabolites (row). Blue and red colors represent low to high abundance relative to the median value (see color scale). (B) Plot of the distribution of the Z score. Each point corresponds to a single technical replicate for a specific metabolite (black, CSAB; red, CRAB). (C) Categories of the differential metabolites in clinically isolated CRAB. (D) The quantities of downregulated and upregulated metabolites in the CRAB group compared to the CSAB group.

