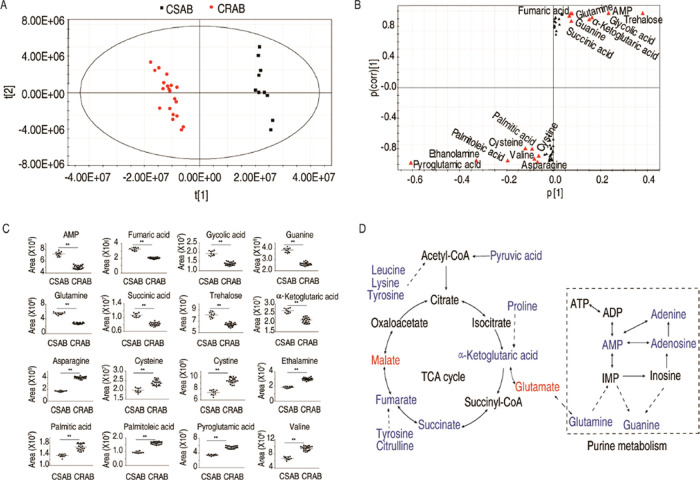
Figure 4.
Identification of the crucial biomarkers. (A) Principal component analysis. Each dotted line represents one technique replicate. (B) S-plot generated from OPLS-DA. Potential biomarkers with predictive component p [1] and correlation p(corr) [1] greater than or equal to 0.05 and 0.5 are highlighted in red triangle. (C) Scatter maps are for crucial biomarkers. (D) Global view for metabolite abundance alteration in CRAB. Blue and red represent low to high abundance of metabolites.

