
Figure 7.
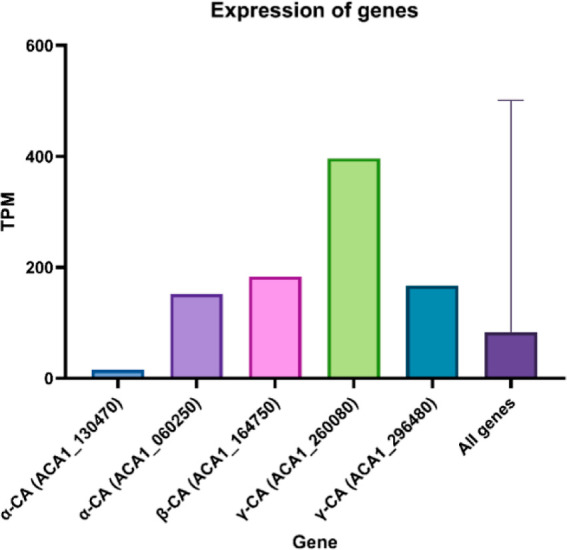
Basal expression levels of five of the eight known CAs of A. castellanii, based on RNA-Seq data (control sample, König et al.).36 Values are given as transcripts per million (TPM), converted from RPKM; UniProt gene identifiers are used.
Official websites use .gov
A
.gov website belongs to an official
government organization in the United States.
Secure .gov websites use HTTPS
A lock (
) or https:// means you've safely
connected to the .gov website. Share sensitive
information only on official, secure websites.
Basal expression levels of five of the eight known CAs of A. castellanii, based on RNA-Seq data (control sample, König et al.).36 Values are given as transcripts per million (TPM), converted from RPKM; UniProt gene identifiers are used.