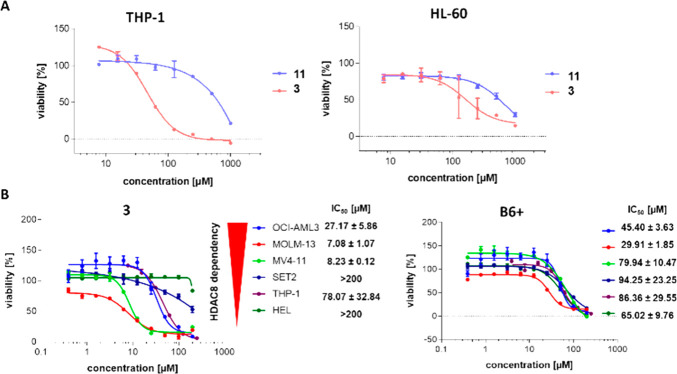
Figure 7.
(A) Cytotoxicity assays of THP-1 and HL-60 cell lines treated with the indicated compounds for 72 h. (B) Cytotoxicity assays of compounds B6+ and 3 on different HDAC8-dependent cell lines. Each cell line was treated with the compound of interest, and the viability was determined using CellTiter-Blue (Promega). Representative dose–response curves are shown, and error bars represent means ± the standard error of the mean (n = 2).

