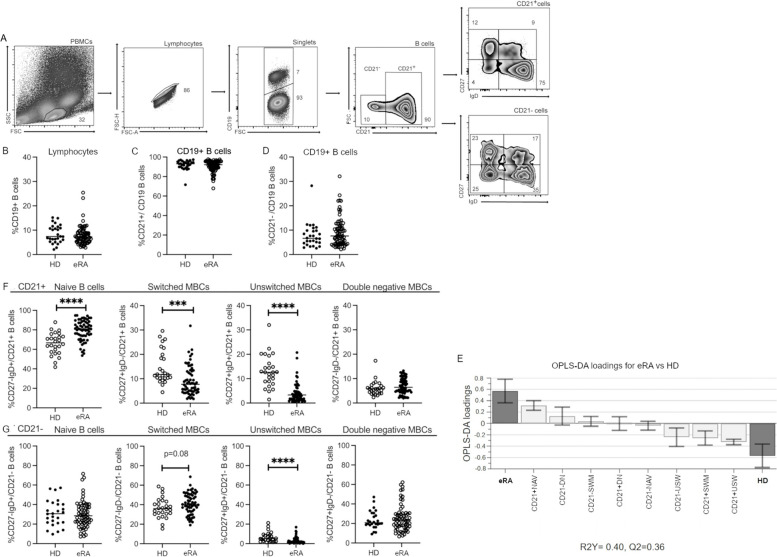
Fig. 1.
Proportions of B cells and B cell subsets in patients with eRA and HD and the association between subsets and disease. A Gating strategy showing gating on PBMCs for lymphocytes, which were further gated for singlets and thereafter CD19+ B cells. CD19+ B cells were further divided into CD21+ and CD21− cells. The CD21+ and CD21− were gated on using a CD27 vs IgD strategy. B Proportion of CD19+ B cells of peripheral blood lymphocytes. C Proportion of CD21+ cells of CD19 + B cells. D Proportion of CD21− cells of CD19 +B cells. E Multivariate factor analysis: An OPLS-DA loading plot showing the association between the different B cell subsets (X-variables) and eRA patients and HD, respectively (Y-variables). X-variables represented by bars pointing in the same direction as a Y-variable are positively associated with that Y-variable, whereas X-variables pointing the opposite direction are negatively related to that Y-variable. R2Y indicates how well the variation of Y is explained and Q2 how well Y can be predicted. F The proportion of the following B cell subsets: Naïve and transitional cells (NAV, CD27−IgD+), switched memory cells (SWM; CD27+IgD−), unswitched memory cells (USW, CD27+IgD+) and double-negative memory cells (DN, CD27−IgD−) of parent population CD21+ B cells. G The proportion of the following B cell subsets: naïve and transitional cells (NAV, CD27−IgD+), switched memory cells (SWM; CD27+IgD−), unswitched memory cells (USW, CD27+IgD+ and double-negative memory cells (DN, CD27−IgD−) of parent population CD21−/low B cells. Mann–Whitney U test was used for statistical comparisons. *** p < 0.001, ****p < 0.0001. Between 1.5 × 10⁵ and 7 × 10⁶ events were recorded per sample. HD, healthy donors; eRA, early rheumatoid arthritis

