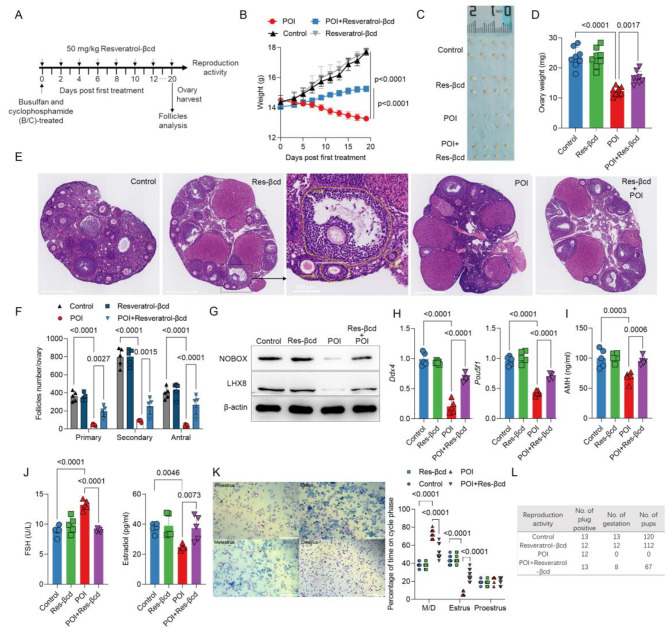
Fig. 2.
Resveratrol-βcd can inhibit the progression of POI in a mouse model. (A) Schematic diagram of resveratrol-βcd treatment; (B) Changes in body weight of the control group, negative control group (resveratrol-βcd alone), POI model group, and treatment group (POI + resveratrol-βcd) during the treatment, n = 5; (C) On the 20 day after treatment began, the ovaries of the mice were isolated and weighed (D), with each point representing the weight of one ovary, n = 8; (E) Typical images of follicles at different stages in the ovaries, scale bar = 500 μm and the corresponding statistical analysis results (F), n = 5; (G) Typical western blot result of LHX8 and NOBOX expression levels in ovarian tissue, n = 3, see the other two western blot replicates in Supplementary Fig. 2; All the repetitive results of western blot in this paper can be found in Supplementary Fig. 2, which will not be described afterwards; (H) Total RNA was extracted from ovarian tissue, and qPCR was used to analyze the transcriptional changes of Ddx4 and Pou5f1, n = 5; (I) On day 20 post treatment, mouse serum was collected to detect AMH, FSH and E2 (J) levels in the blood, n = 5. (K) Estrous cycles examination by vaginal smears, scale bar = 200 μm, percentage of time on cycle phase was shown on the right, M/D = Metestrus and Diestrus, n = 10; (L) Reproductive activity analysis of different treatment group, n = 15; Statistical analysis was performed using two-way ANOVA (B), and one-way ANOVA (D,F,H,I,J and K) comparison was made POI vs. control, POI vs. resveratrol-βcd and POI vs. POI + resveratrol-βcd; ns, not significant

