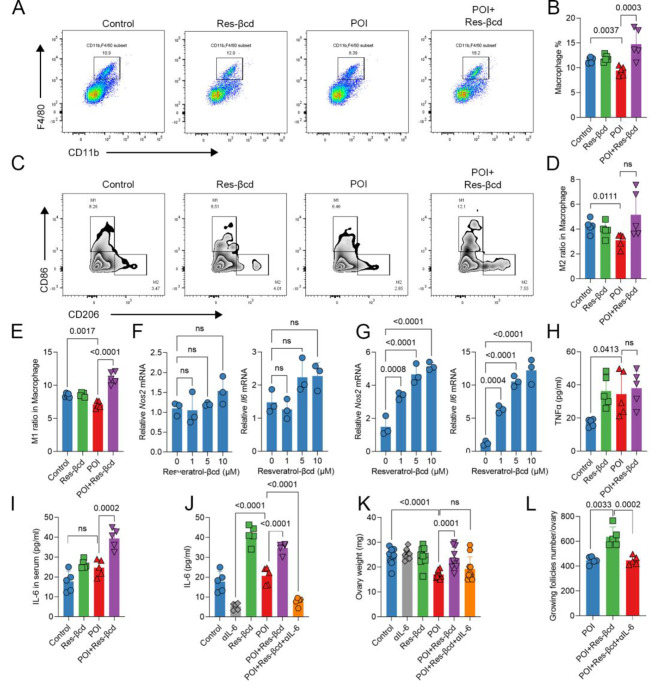
Fig. 4.
Resveratrol-βcd activates primary macrophages. (A) Representative flow cytometry dot plot of macrophages in ovarian tissue and the proportion of macrophages in different groups (B), n = 5; (C) Representative flow cytometry contour plot of M1 and M2 macrophages differentiated by CD86 and CD206, as well as the proportion of M2-like (D) and M1-like (E) macrophages, n = 5; (F) RAW264.7 and primary macrophages from peritoneal sources (G) were cocultured with resveratrol-βcd at indicated concentrations for 24 h, and the transcription levels of Nos2 and Il6 were analyzed, n = 3; (H) On the 20th day of the treatment cycle, mouse serum was collected to measure the levels of TNFα and IL-6 (I) in peripheral blood, n = 5; (J) In the IL-6 neutralization experiment, mice were injected with 200 µg/each IL-6 antibody via tail vein at the same time point as the Resveratrol-βcd treatment, and on the day 20 post treatment began, the level of IL-6 in peripheral blood and ovary was detected, n = 5; (K) The ovaries of mice were dissected and weighed, with each point representing the weight of one side of the ovary, n = 10; (L) Statistical results of the number of all growing follicles in the ovaries, n = 5. Statistical analysis was performed using one-way ANOVA, comparison was made POI vs. each other groups in B,D,E,H,I,J,K and L; one-way ANOVA comparison was made 0 µM resveratrol-βcd vs. 1 µM, 5 µM or 10 µM resveratrol-βcd in F and G; ns, not significant

