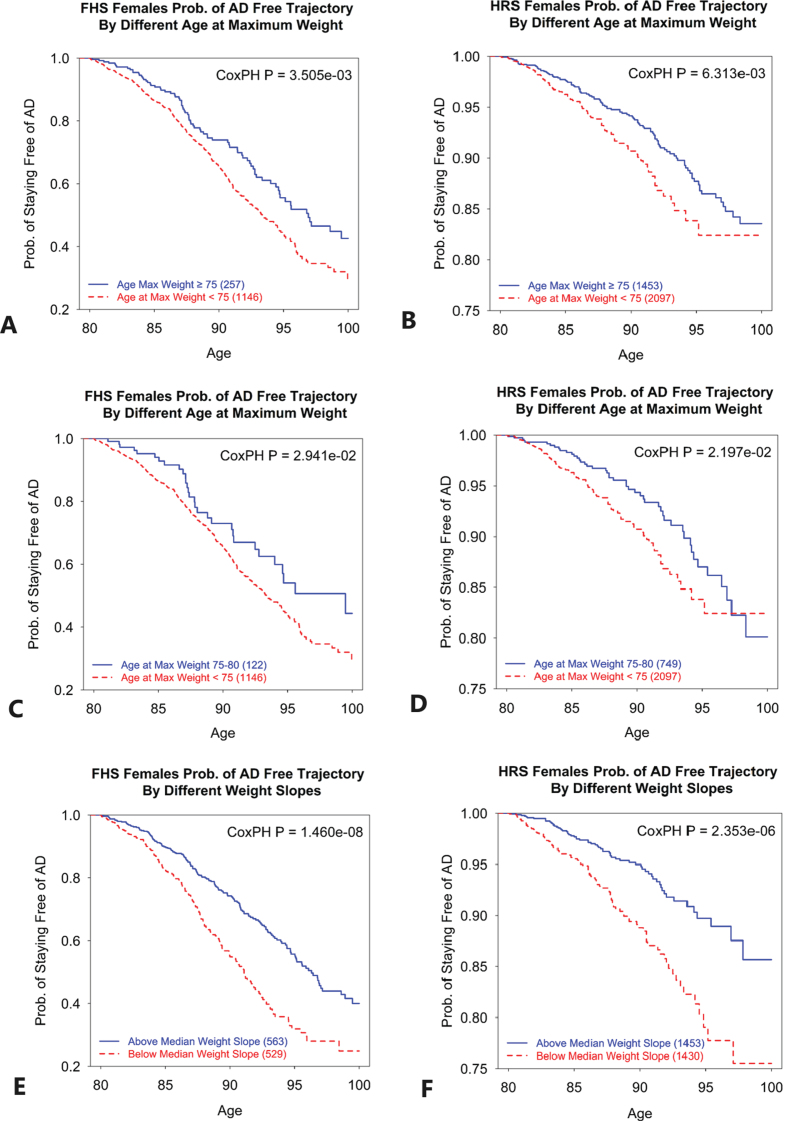
Fig. 2.
Trajectories of probability of staying AD-free for women with different ages at maximum weight, and different slopes of weight. A) Probability of staying free of AD at ages 80+ for women who reached maximum weight at ages 75 or older (solid line), compared to those who reached maximum weight at ages younger than 75 (dashed line). FHS. B) Probability of staying free of AD at ages 80+ for women who reached maximum weight at ages 75 or older (solid line), compared to those who reached maximum weight at ages younger than 75 (dashed line). HRS. C) Probability of staying free of AD at ages 80+ for women who reached maximum weight at ages 75–80 (solid line), compared to those who reached maximum weight at ages younger than 75 (dashed line). FHS. D) Probability of staying free of AD at ages 80+ for women who reached maximum weight at ages 75–80 (solid line), compared to those who reached maximum weight at ages younger than 75 (dashed line). HRS. E) Probability of staying free of AD at ages 80+ for women with slope of weight change above median (solid line), meaning slower or no decline in weight, compared to women with slope of weight change below median (dashed line), meaning faster decline in weight. FHS. F) Probability of staying free of AD at ages 80+ for women with slope of weight change above median (solid line), meaning slower or no decline in weight, compared to women with slope of weight change below median (dashed line), meaning faster decline in weight. HRS. The CoxPH P is p-value for testing the null hypothesis that the regression coefficient for respective variable is zero.

