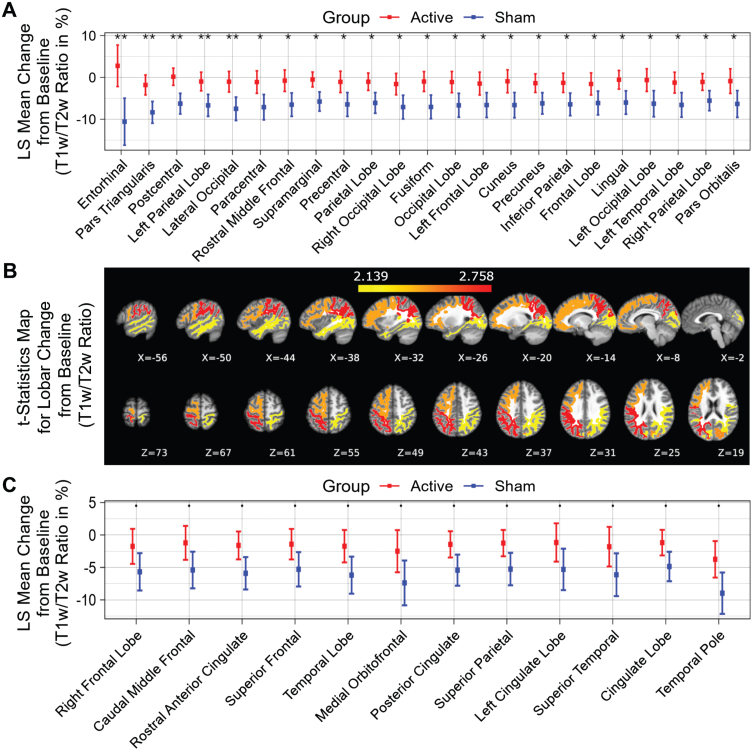
Fig. 3.
T1w/T2w ratio change in white matter structures (% change from baseline) for a 6-month period; all statistically significant differences favor the active treatment group. LS Mean sum of T1w/T2w ratio changes in the white matter structures (A), sorted in ascending order by p-value, shows the significant difference (p < 0.05) between the Active Treatment group participants (Red) and the Sham group participants (Blue), favoring the active treatment group. (B), Maps of the t-statistics showing LS Mean lobar white matter myelin content changes of the difference between the active treatment group and sham group. The colorbar depicts the values of the T-maps after thresholding at the p = 0.05 level; a high value indicates more lobar white matter myelin preservation in the active treatment group. The images are shown in neurological convention. LS Mean sum of T1w/T2w ratio changes in the white matter structures (C), sorted in ascending order by p-value, shows the marginal difference (0.05≤p < 0.1) between the Active Treatment group participants (Red) and the Sham group participants (Blue), favoring the Active Treatment group. Error bars indicate SE. ** for p < 0.01, * for 0.01≤p < 0.05, and • for 0.05 ≤ p < 0.1.

