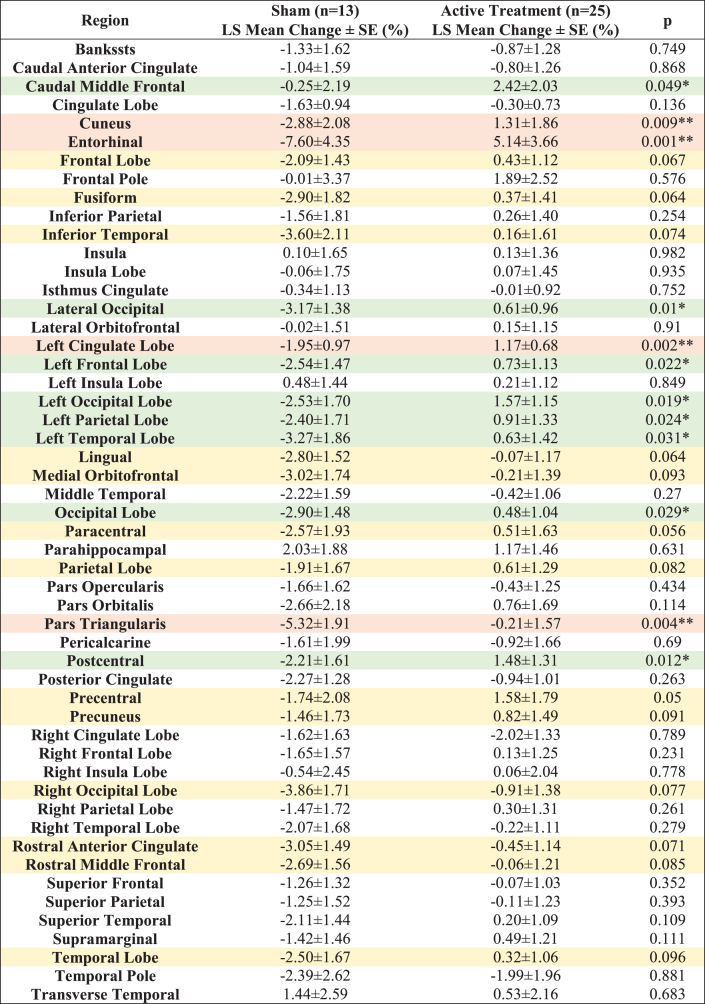
Table 2.
LS Mean volume changes for 52 white matter structures from baseline (%) for a 6-month period. All the statistically significant changes favor the Active Treatment group over the Sham group. Light orange shaded areas for p < 0.01, light green shaded areas for 0.01≤p < 0.05 and light-yellow shaded areas for 0.05≤p < 0.1

