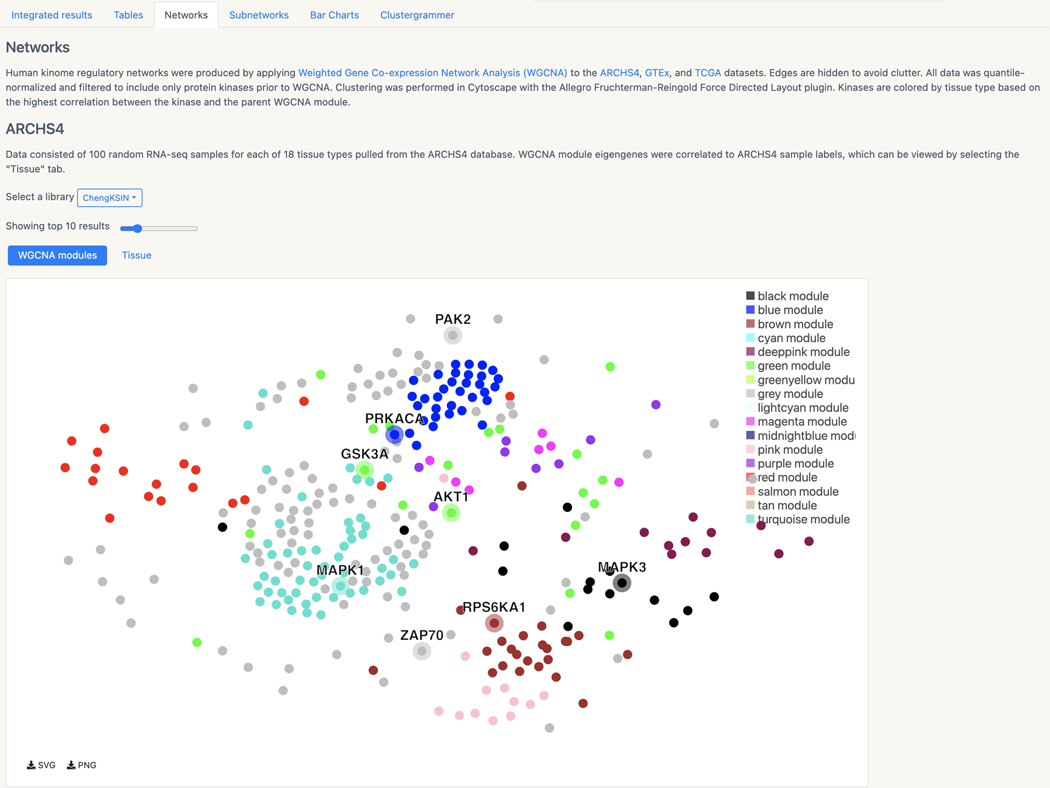
Figure 128.
Networks tab displaying human kinome regulatory networks that were produced by applying Weighted Gene Co-expression Network Analysis (WGCNA) to ARCHS4, GTEx, and TCGA datasets. Kinases are colored by tissue type based on the highest correlation between the kinase and parent WGCNA module.

