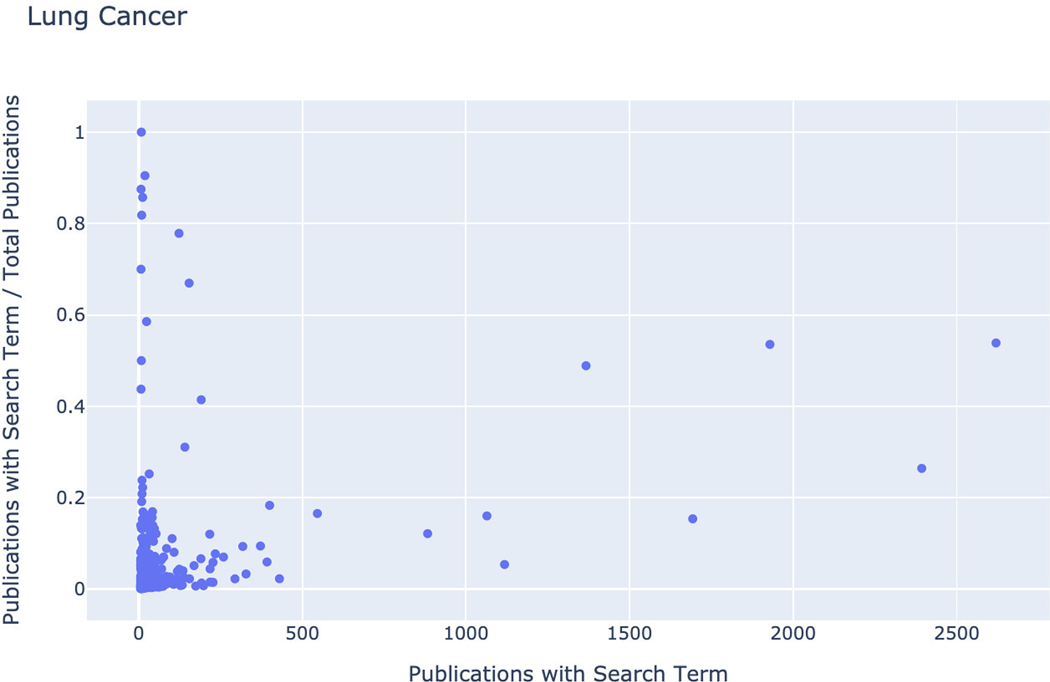
Figure 134.
Scatter Plot of Drug Frequency in Literature. The X axis displays the integer counts of Publications with Search Term, and the Y axis shows the fraction of Publications with Search Term / Total Publications. Hovering over any point on this plot displays the compound’s name and its corresponding X and Y values.

