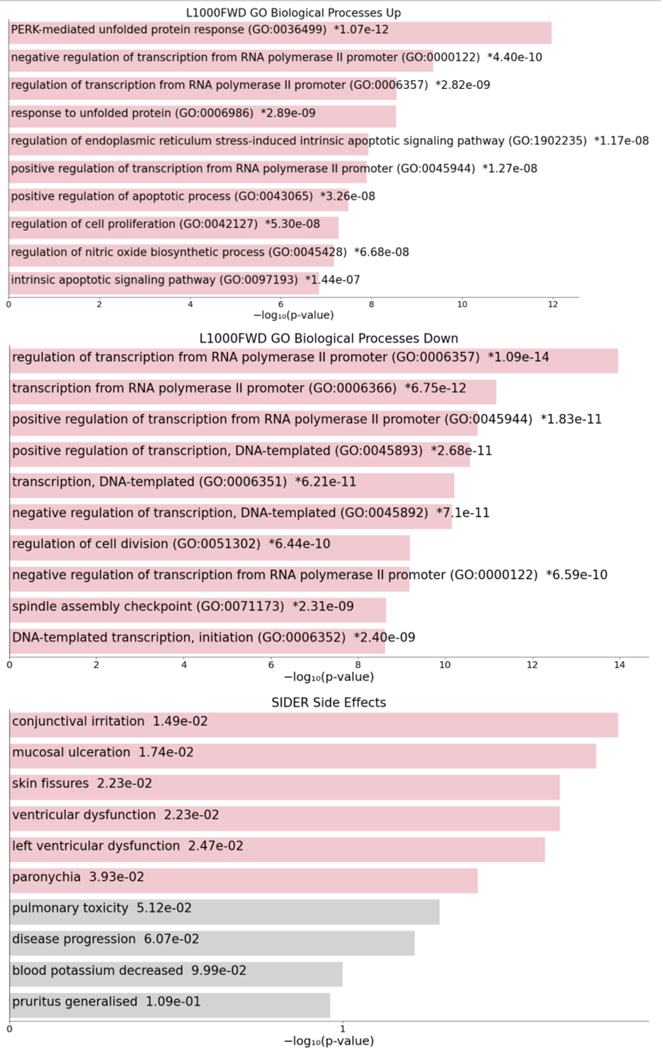
Figure 142.
Bar plots of top 10 enriched terms across three separate drug set libraries after drug set enrichment analysis of the top 50 co-expression predicted drugs using the DrugEnrichr API. Colored bars correspond to terms with significant p-values (<0.05). An asterisk (*) next to a p-value indicates the term also has a significant adjusted p-value (<0.05).

