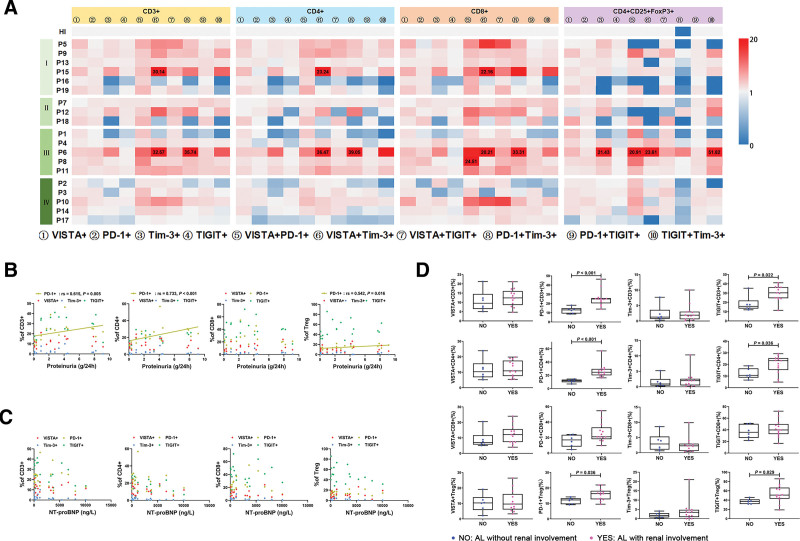
Figure 4.
Correlations between T cell subsets expressing VISTA/PD-1/Tim-3/TIGIT in PB and clinical features of AL amyloidosis. (A) Heatmap representing the frequency of single positive (VISTA or PD-1 or Tim-3 or TIGIT) subsets or double-positive (co-expression with each other) subsets within CD3+ T, CD4+ T, CD8+ T, and Treg from 19 patients with AL amyloidosis (stage I: 6 cases, stage II: 3 cases, stage III: 5 cases, and stage IV: 5 cases) compared with HIs. (B) Spearman correlation test between relative counts of VISTA/PD-1/Tim-3/TIGIT+ subsets within CD3+ T, CD4+ T, CD8+ T, Treg and 24-h proteinuria levels. (C) Spearman correlation test between relative counts of VISTA/PD-1/Tim-3/TIGIT+ subsets within CD3+ T, CD4+ T, CD8+ T, Treg, and NT-proBNP levels. (D) Comparison of the percentage of VISTA/PD-1/Tim-3/TIGIT+ T cell or Treg between patients with renal involvement (n = 13) and patients without renal involvement (n = 6). AL = amyloid light chain, HIs = healthy individuals, NT-proBNP = N-terminal pro-B-type natriuretic peptide, PB = peripheral blood, PD-1 = programmed cell death-1, rs = Spearman’s rank correlation coefficient, TIGIT = T cell immunoreceptor with Ig and ITIM domains, Tim-3 = T cell immunoglobulin and mucin-domain-containing-3, Treg = regulatory T cell, VISTA = V-domain immunoglobulin suppressor of T cell activation.

