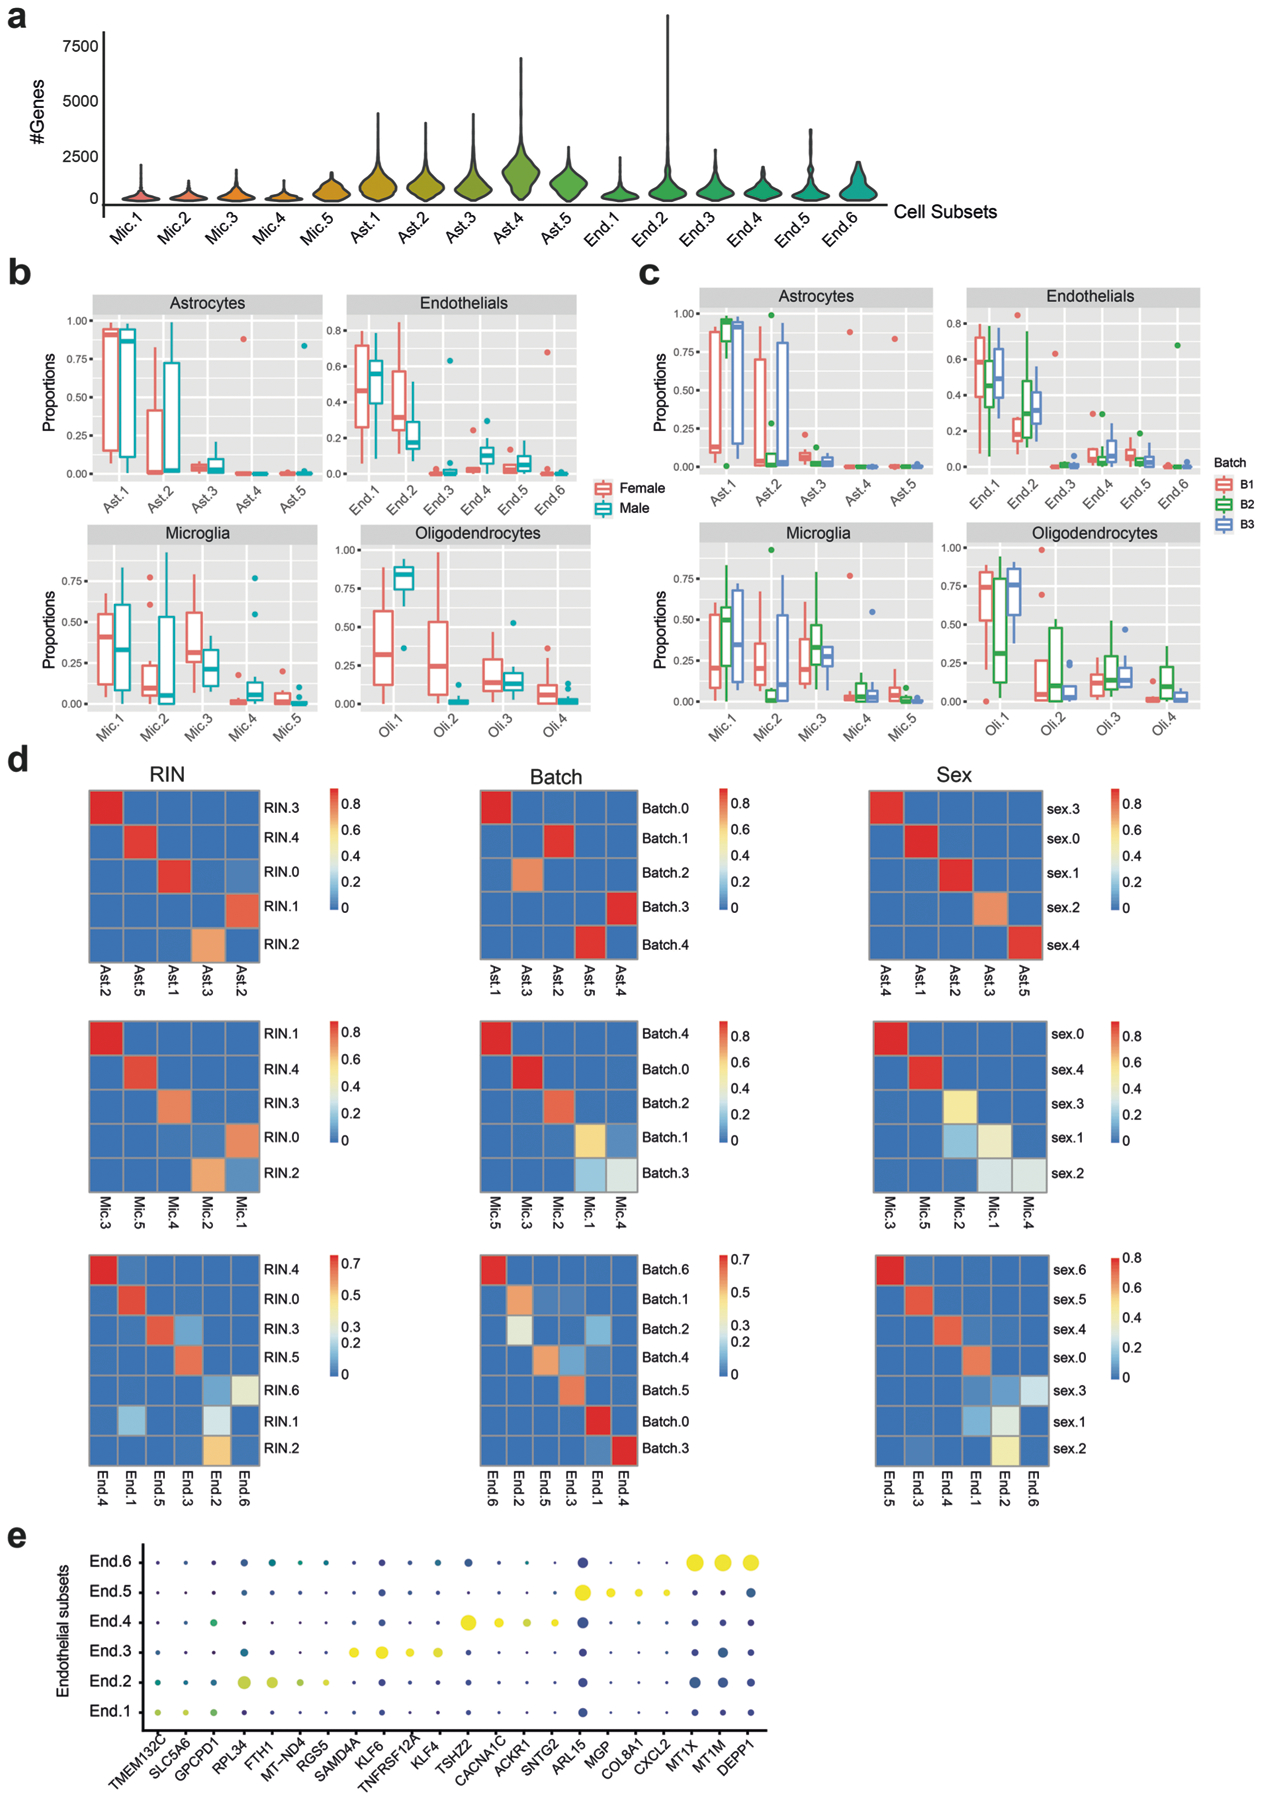
Extended Data Fig. 3 |. Quality controls of glial subsets.

(a) Distribution of number of genes across microglia, astrocytes and endothelial clusters (denoted as subsets). (b, c) Distribution of non-neuronal subsets frequencies across sex and batch for n = 24 independent samples. Boxplot showing the fraction of nuclei per neuronal subtype for sex (b, n = 12 per group) or batch (c, n = 8 per group): For box plots, the bottom and upper borders show the first and third quartiles. The central line indicates the median. The whiskers are extended to the extrema values (without accounting for outliers). Dots show outlier samples. (d) RIN, sex and batch do not affect the sub-clustering of astrocytes, microglia and endothelial cells. Heatmaps of Jaccard score comparing overlaps of cells (color scales) between assignment of de-novo clusters after regression of the confounding variables from the expression matrix (rows) compared to the clusters in this study without such correction (columns) (Methods). (e) Endothelial subsets express unique markers. Dot plot of the mean expression level in expressing cells (color) and percent of expressing cells (circle size) of selected marker genes across endothelial subsets.
