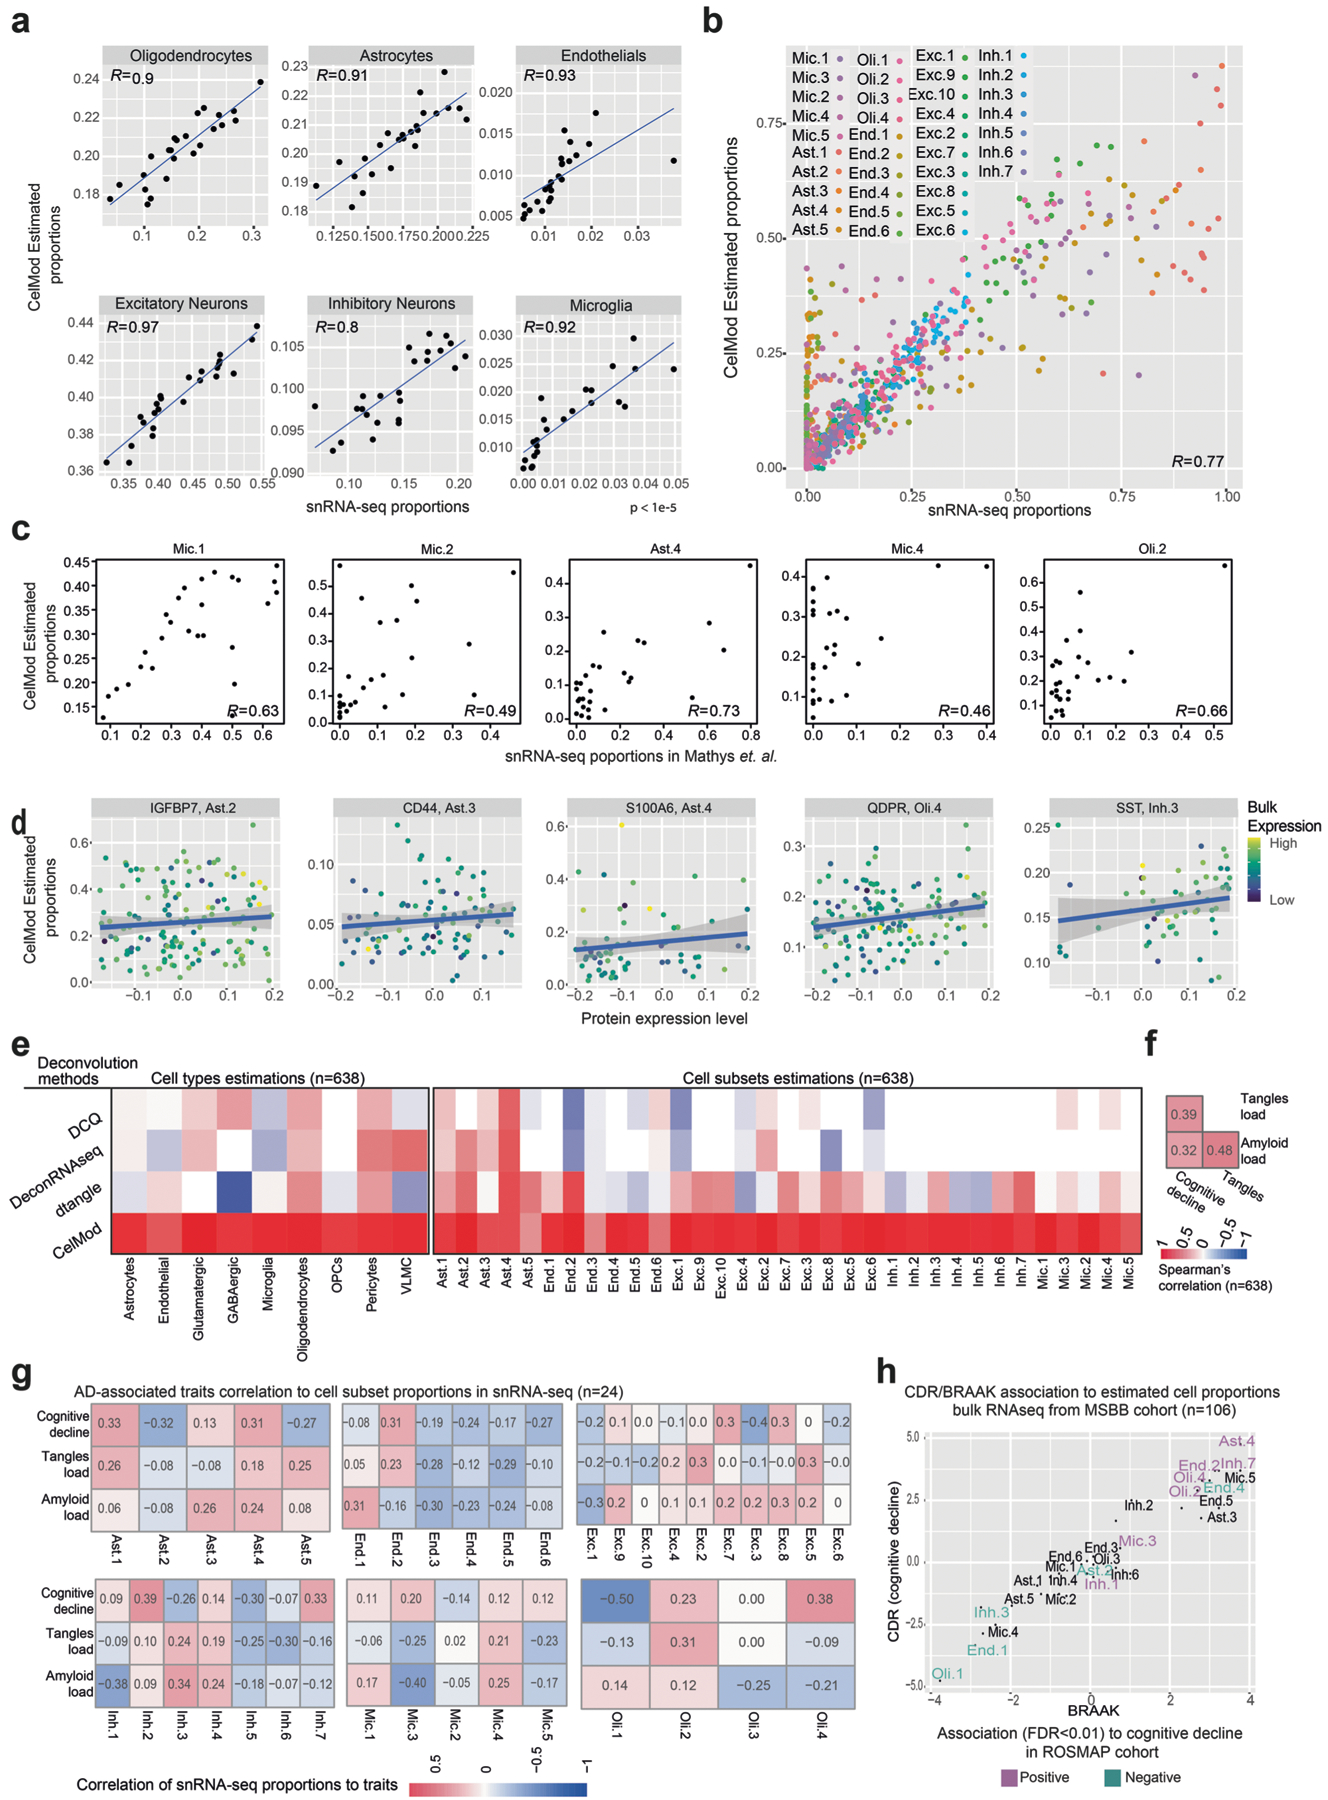
Extended Data Fig. 6 |. CelMod evaluation and comparison to other methods and datasets.

(a, b) CelMod estimated proportions match sn-RNAseq measured proportions. Scatter plots of CelMod proportions (Y-axis) compared to snRNA-seq proportions (X-axis), for 6 major cell classes (a) and all cell subsets and topic models (b, colored by subset). Line: linear regression. Each point is a sample (n = 24 independent samples). (c) Validation of CelMod in an independent dataset. CelMod estimated proportions of cell subsets (Y-axis) compared to snRNA-seq proportions (X-axis) measured across n = 48 independent samples of the prefrontal cortex Brodmann area 10 (Mathys et al.3). Each point is a single individual. Cell subset annotations are based on our cell atlas (Methods). R=Correlation. (d) Protein expression of selected markers reflect cell subsets abundance. Scaled protein expression levels (X-axis) compared to CelMod estimated proportions of the related cell subset, colored by the bulk RNA-seq (proteomics30 in n = 196 independent individuals with matching bulk RNA profiles). Each point is a single individual. Line: linear regression fit with confidence interval (grey). (e) CelMod outperforms previous methods. Spearman correlation scores (color scale) of the snRNA-seq measured proportions of each cell type (left) and cell subset (right), compared to the estimated proportions by CelMod and three previous models. (f) Correlations between AD traits within our data. Pairwise correlations (color scale) of the three traits across n = 638 independent individuals. (g) Measured proportions of cellular subsets from snRNA-seq in n = 24 individuals correlate with AD pathology and cognitive decline. Correlation (color scale) of the proportions of each cell subset (columns) to AD-traits (rows). The proportions are calculated over the total number of nuclei per individual (n = 24) within each cell. (h) Cellular proportions associations to AD-ranking in the independent MSBB32 cohort matches the ROSMAP1 cohort. Association scores −log(FDR) ×sign (β), by multivariable linear regression) of proportions of cell subsets to two measures of AD ranking: BRAAK stage (tangles load) and the CDR (level of cognitive decline), in n = 106 independent samples32 (Methods). Cell subsets colored by the statistical significance of associations to the cognitive decline rate in the ROSMAP cohort1 (n = 638).
