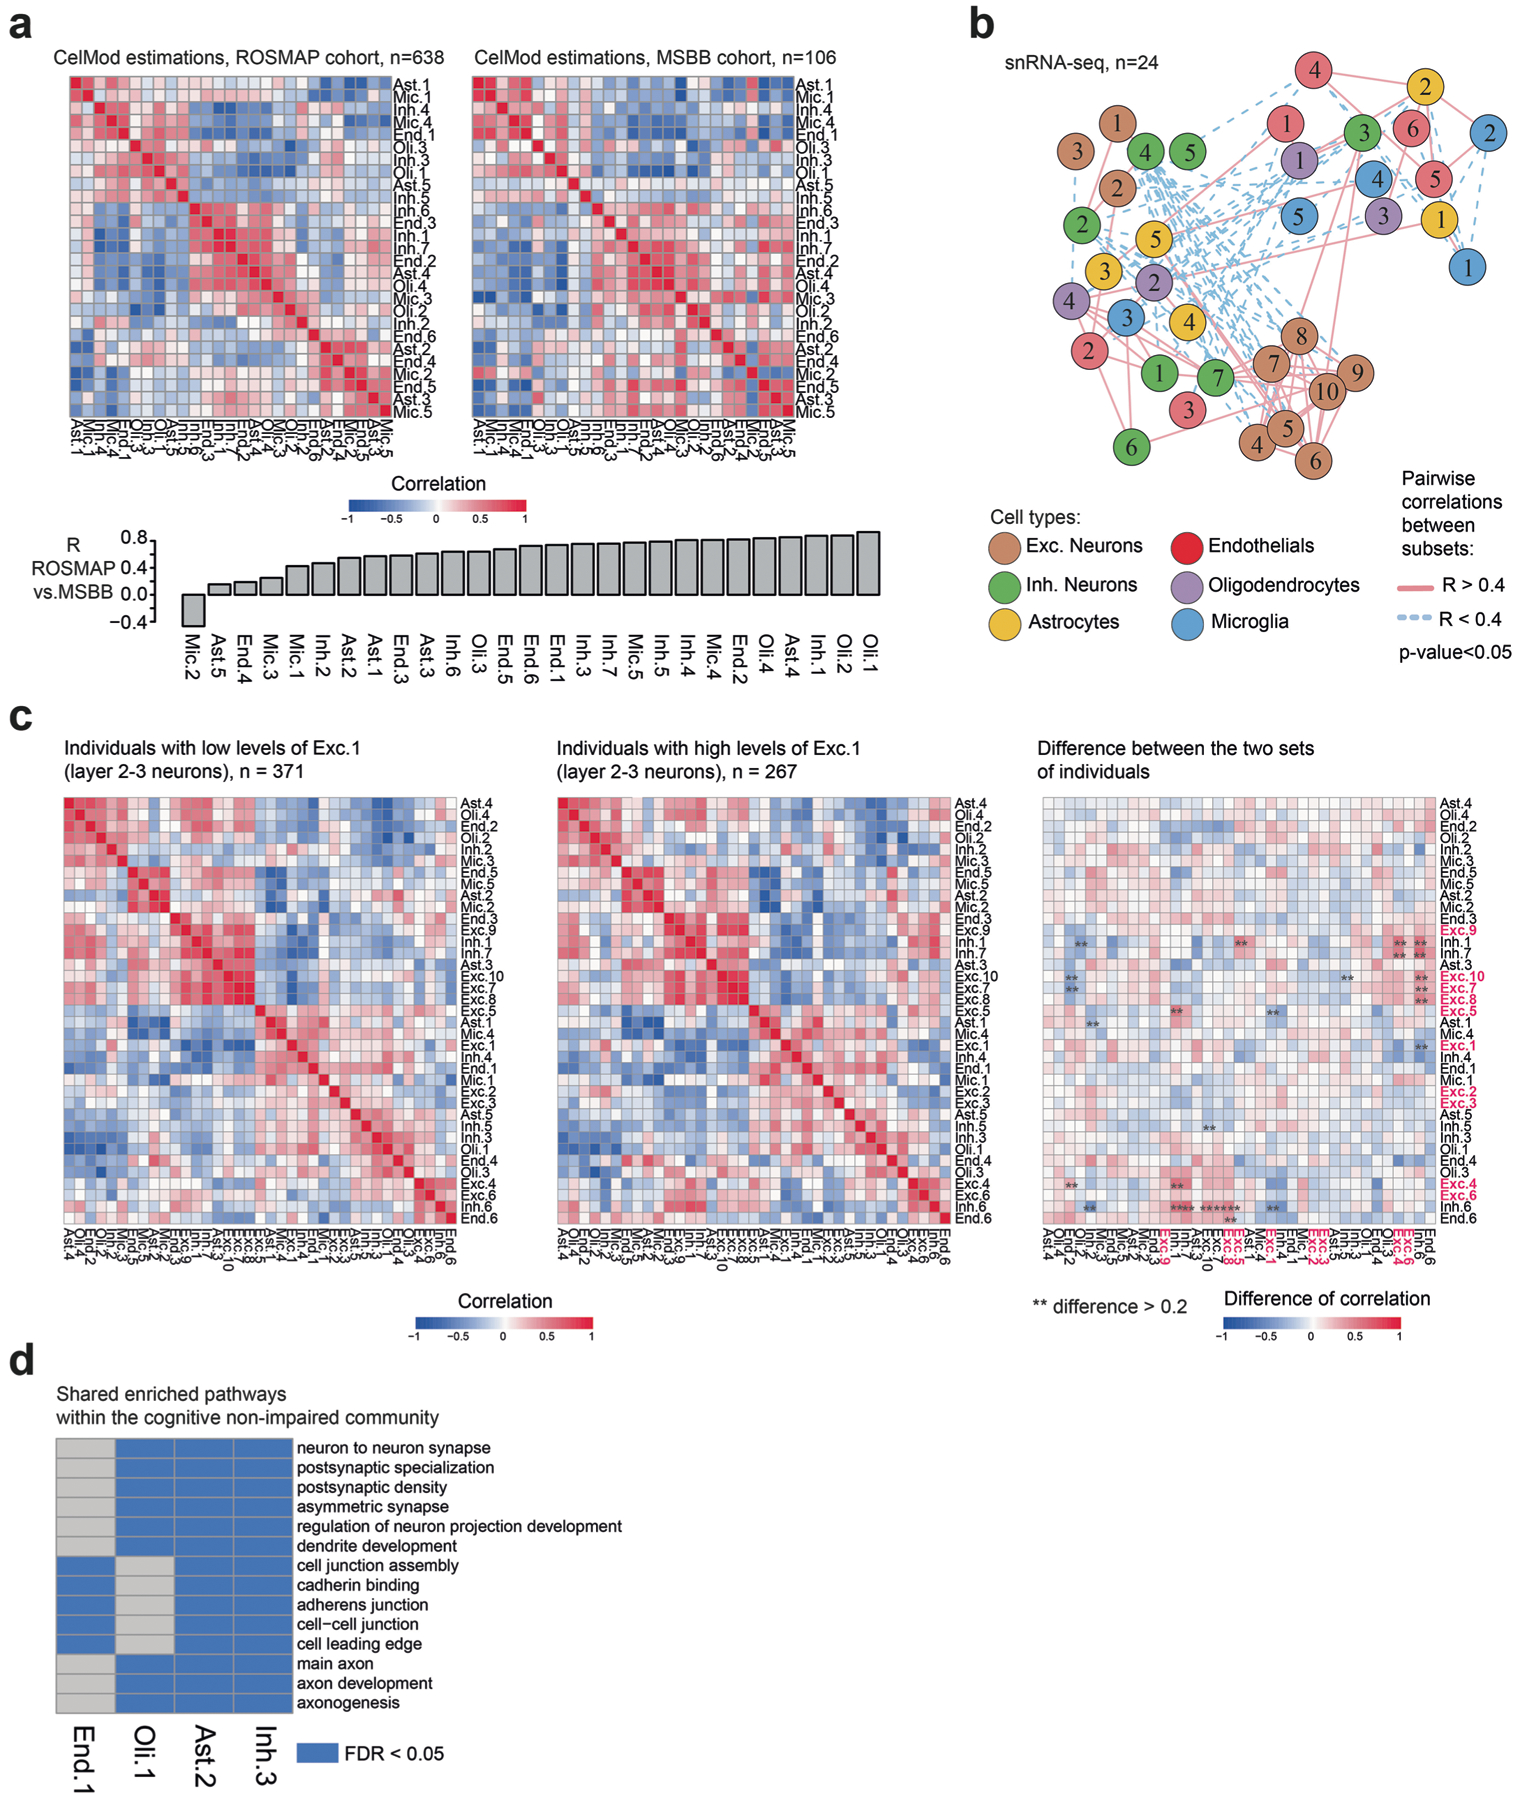
Extended Data Fig. 7 |. Evaluation of multi-cellular communities.

(a) Similar structure of coordinated changes between proportions of cell subsets and neuronal subtypes across individuals found in two independent cohorts. Pairwise Spearman correlation coefficients of the proportions of cell states and subtypes across individuals estimated by CelMod in bulk RNA-seq data of ROSMAP1 (left) and MSBB32 (right) cohorts. Bottom: Correlation between the pairwise association pattern of the ROSMAP and the MSBB cohorts per cell subset. (b) A network of cellular subsets reveals coordinated variation across individuals in multiple cell types. Network of coordinated and anti-coordinated cell subsets (nodes). Edges between pairs of subsets with statistically significant correlated proportions across individuals (r>0.4, p-value threshold=0.05, solid red line) or anti-correlated (r < −0.4, dashed blue line) based on snRNA-seq proportions (n = 24 independent samples, Spearman correlation, two sided, not adjusted for multiple comparison). Celmod based network in n = 638 individuals in Fig. 6b. Nodes are colored by the cell type and numbered by the subset as in Fig. 2a and Fig. 3a, d, h). (c) Coordinated changes in proportions of cell states and subtypes across individuals is independent of the cortical layer, except for excitatory neurons. Pairwise Spearman correlation coefficient of the CelMod proportions of all cell subsets and neuronal subtypes across individuals with low levels of Exc.1 (n = 371 individuals, left) or high levels of Exc.1 (n = 267 individuals, middle). Right: The differences in pairwise correlations between the Exc.1-high and Exc.1-low groups of individuals. Showing the partition mainly affects excitatory neurons (red). (d) Shared pathways within the cognitive non-impaired community. Enriched pathways (hypergeometric test, FDR q-value < 0.05, blue) in up-regulated genes for each cell subset within the cognitively non-impaired community (End.1, Oli.1, Ast.2, and Inh.3). Displaying shared enriched pathways between at least three subsets.
