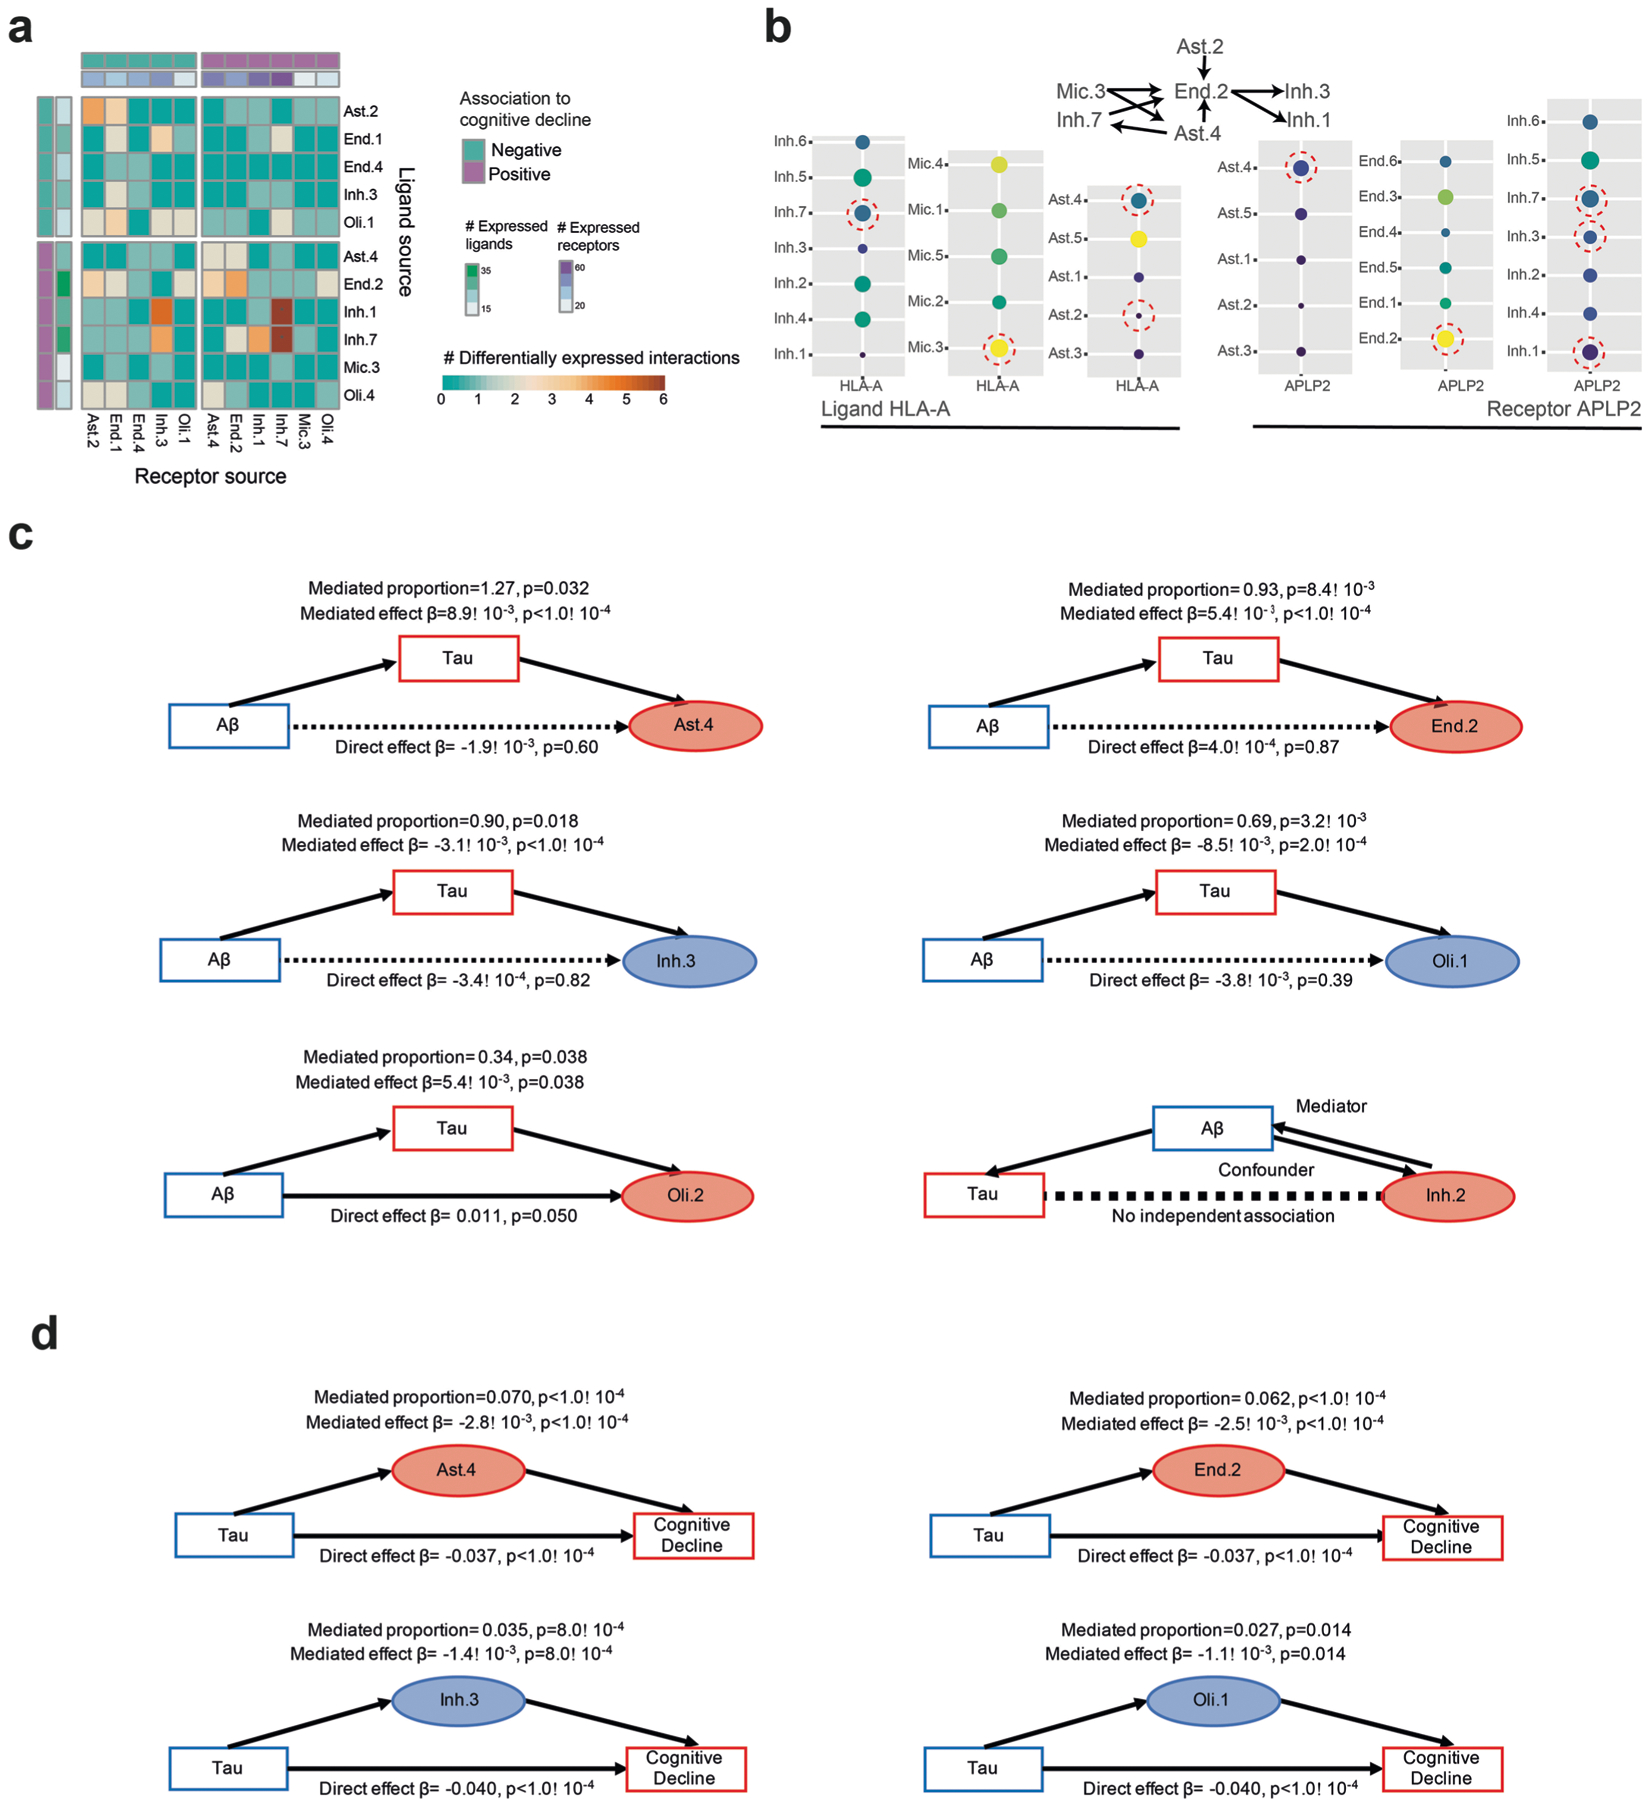
Extended Data Fig. 8 |. Signaling within and between multi-cellular communities and causal modeling.

(a) Cell subsets positively associated with cognitive decline have an increased expression of ligand-receptor pairs compared to the negatively associated subsets. For each pair of cell subsets showing the number (color scale) of ligand-receptor pairs (LRP, row: ligand, column: receptor) where both the ligand and the receptor are differentially expressed in the relevant subsets. Top and side bar marking: subsets positively (purple) or negatively (turquoise) associated with cognitive decline, and the total number of ligands and receptors expressed (color scale). (b) Expression of the HLA-A - APLP2 ligand-receptor pair across subtypes of different cell types. Dot plot of the mean expression level in expressing cells (color) and percent of expressing cells (circle size) of HLA-A and of APLP2 across subsets of selected cell types. (c) Mediation analysis results showing tangle pathology burden (tau) is predicted to be upstream of changes in proportion of Inh.3, Oli.1, Oli.2, Ast.4, and End.2, but not Inh.2. (d) Mediation analysis results showing partial effect of changes in proportion of Inh.3, Olig.1, Ast.4, and End.2 on cognitive decline independent of tau pathology burden.
