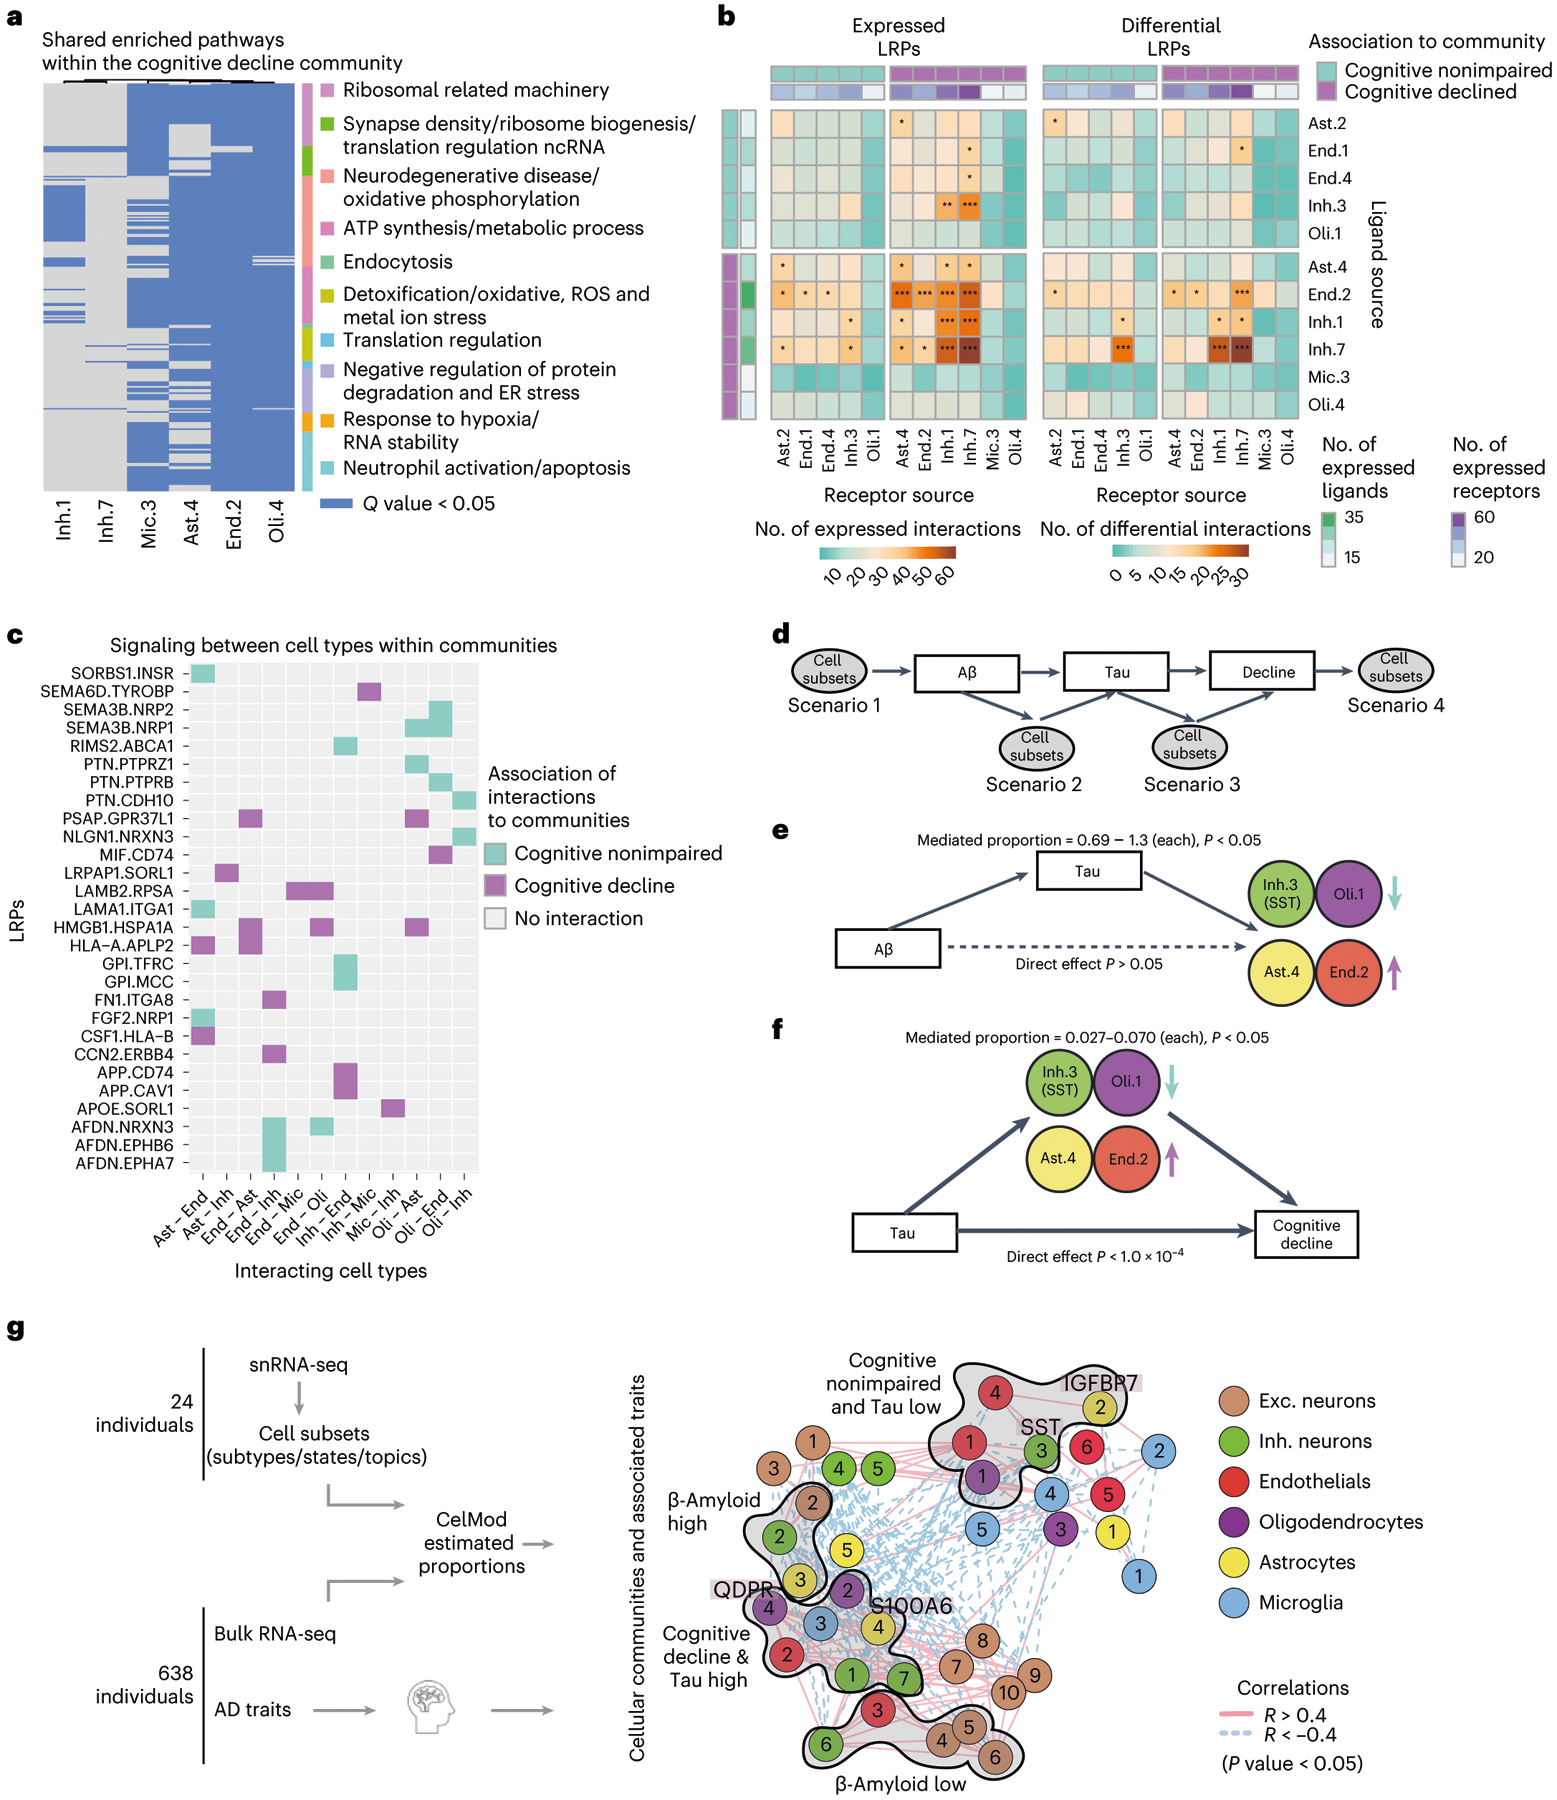
Fig. 7 |. The cellular environment of the AD and the cognitively nonimpaired brains.

a, Shared pathways within the cognitive decline community. Enriched pathways (hypergeometric test, FDR Q < 0.05) in up-regulated genes within each cell subset, shared between at least three subsets within the community. Pathways clustered by shared genes (Methods). Nonimpaired community shared pathways are shown in Extended Data Fig. 7d. b, Increased LRPs between cell subsets of the cognitive decline community compared with the nonimpaired community. For each pair of cell subsets, showing the number of LRPs (colorbar, row, ligand; column, receptor) that are expressed (left) or differentially expressed in at least one of the subsets (right). Top and side bars, positive (purple) or negative (turquoise) association with cognitive decline, and the number of expressed LRPs (color scale). c, Examples of community-specific LRPs. For each LRP, marking the association to each pair of cell subsets with the cognitive decline community (purple) or the cognition nonimpaired community (turquoise) or no-association (gray). LRPs are associated to a community if the ligand and its receptor are positively differentially expressed in cell subsets within one community compared with the other. d, A scheme of underlying assumptions and four possible scenarios of the cell subset causal relationship with AD pathology and cognitive decline assessed by mediation analysis. e, Mediation analysis results showing that tau pathology burden is predicted to be upstream of changes in proportions of Inh.3, Oli.1, Ast.4 and End.2. Colored by cell type, the arrow indicates the direction of change in proportion in association with cognitive decline and tangles burden. Full results are shown in Extended Data Fig. 8c. f, Mediation analysis results showing effect of changes in proportions of Inh.3, Oli.1, Ast.4 and End.2 on cognitive decline independent of tau pathology burden. Colors and arrows as in e. Full results are shown in Extended Data Fig. 8d. g, A scheme of our proposed model of multicellular communities of the aging DLPFC brain region and their associations with AD traits. Cellular networks (as in a), nodes colored by the community assignments. The statistically significant enriched associations to AD traits (hypergeometric P value) are marked next to the graph.
