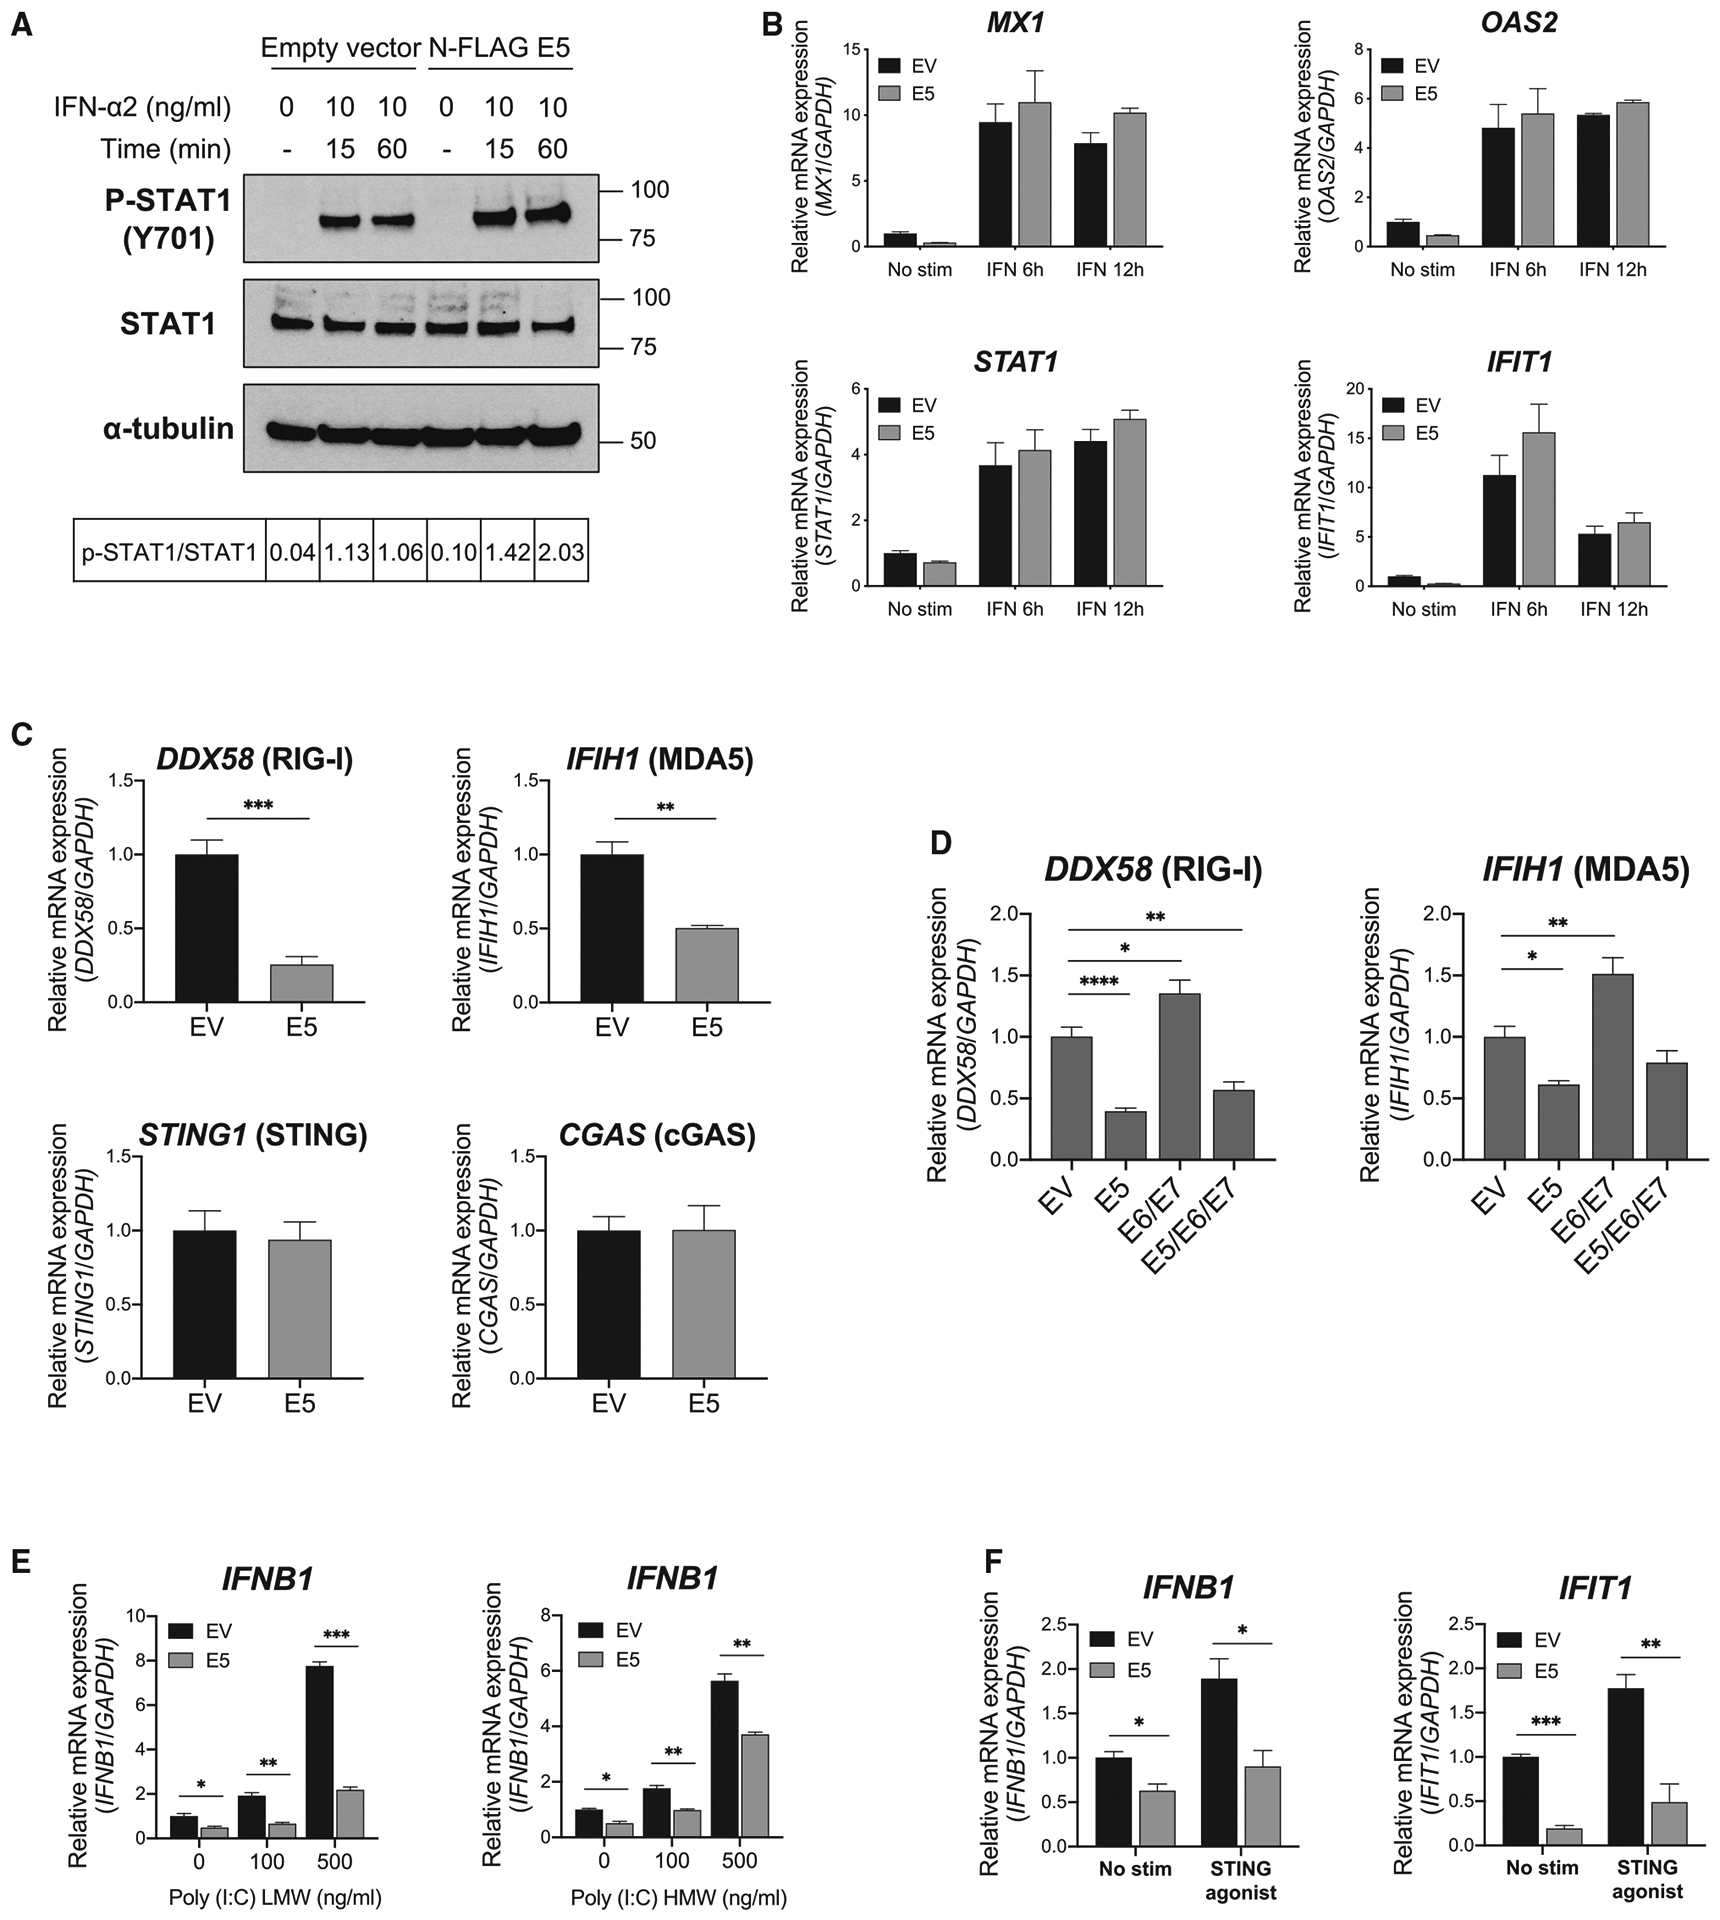
Figure 5. HPV E5 inhibited the cGAS-STING and RIG-I/MDA5 pathways.

(A) Phosphorylation of STAT1 after IFN-α treatment in CAL-27 cells was analyzed by western blotting. The ratio of p-STAT1/total STAT1 is shown.
(B) mRNA expression in CAL-27 cells was analyzed by qPCR. Cells were treated with IFN-α at 10 ng/mL for 6 or 12 h
(C and D) Basal mRNA expression in CAL-27 cells was analyzed by qPCR.
(E) mRNA expression was analyzed after poly(I:C) treatment for 4 h at the indicated concentrations. LMW, low molecular weight; HMW, high molecular weight.
(F) mRNA expression after STING agonist treatment was analyzed. Cells were treated with 10 μg/mL of STING agonist for 4 h. Data are represented as mean ± SEM (n = 3).
