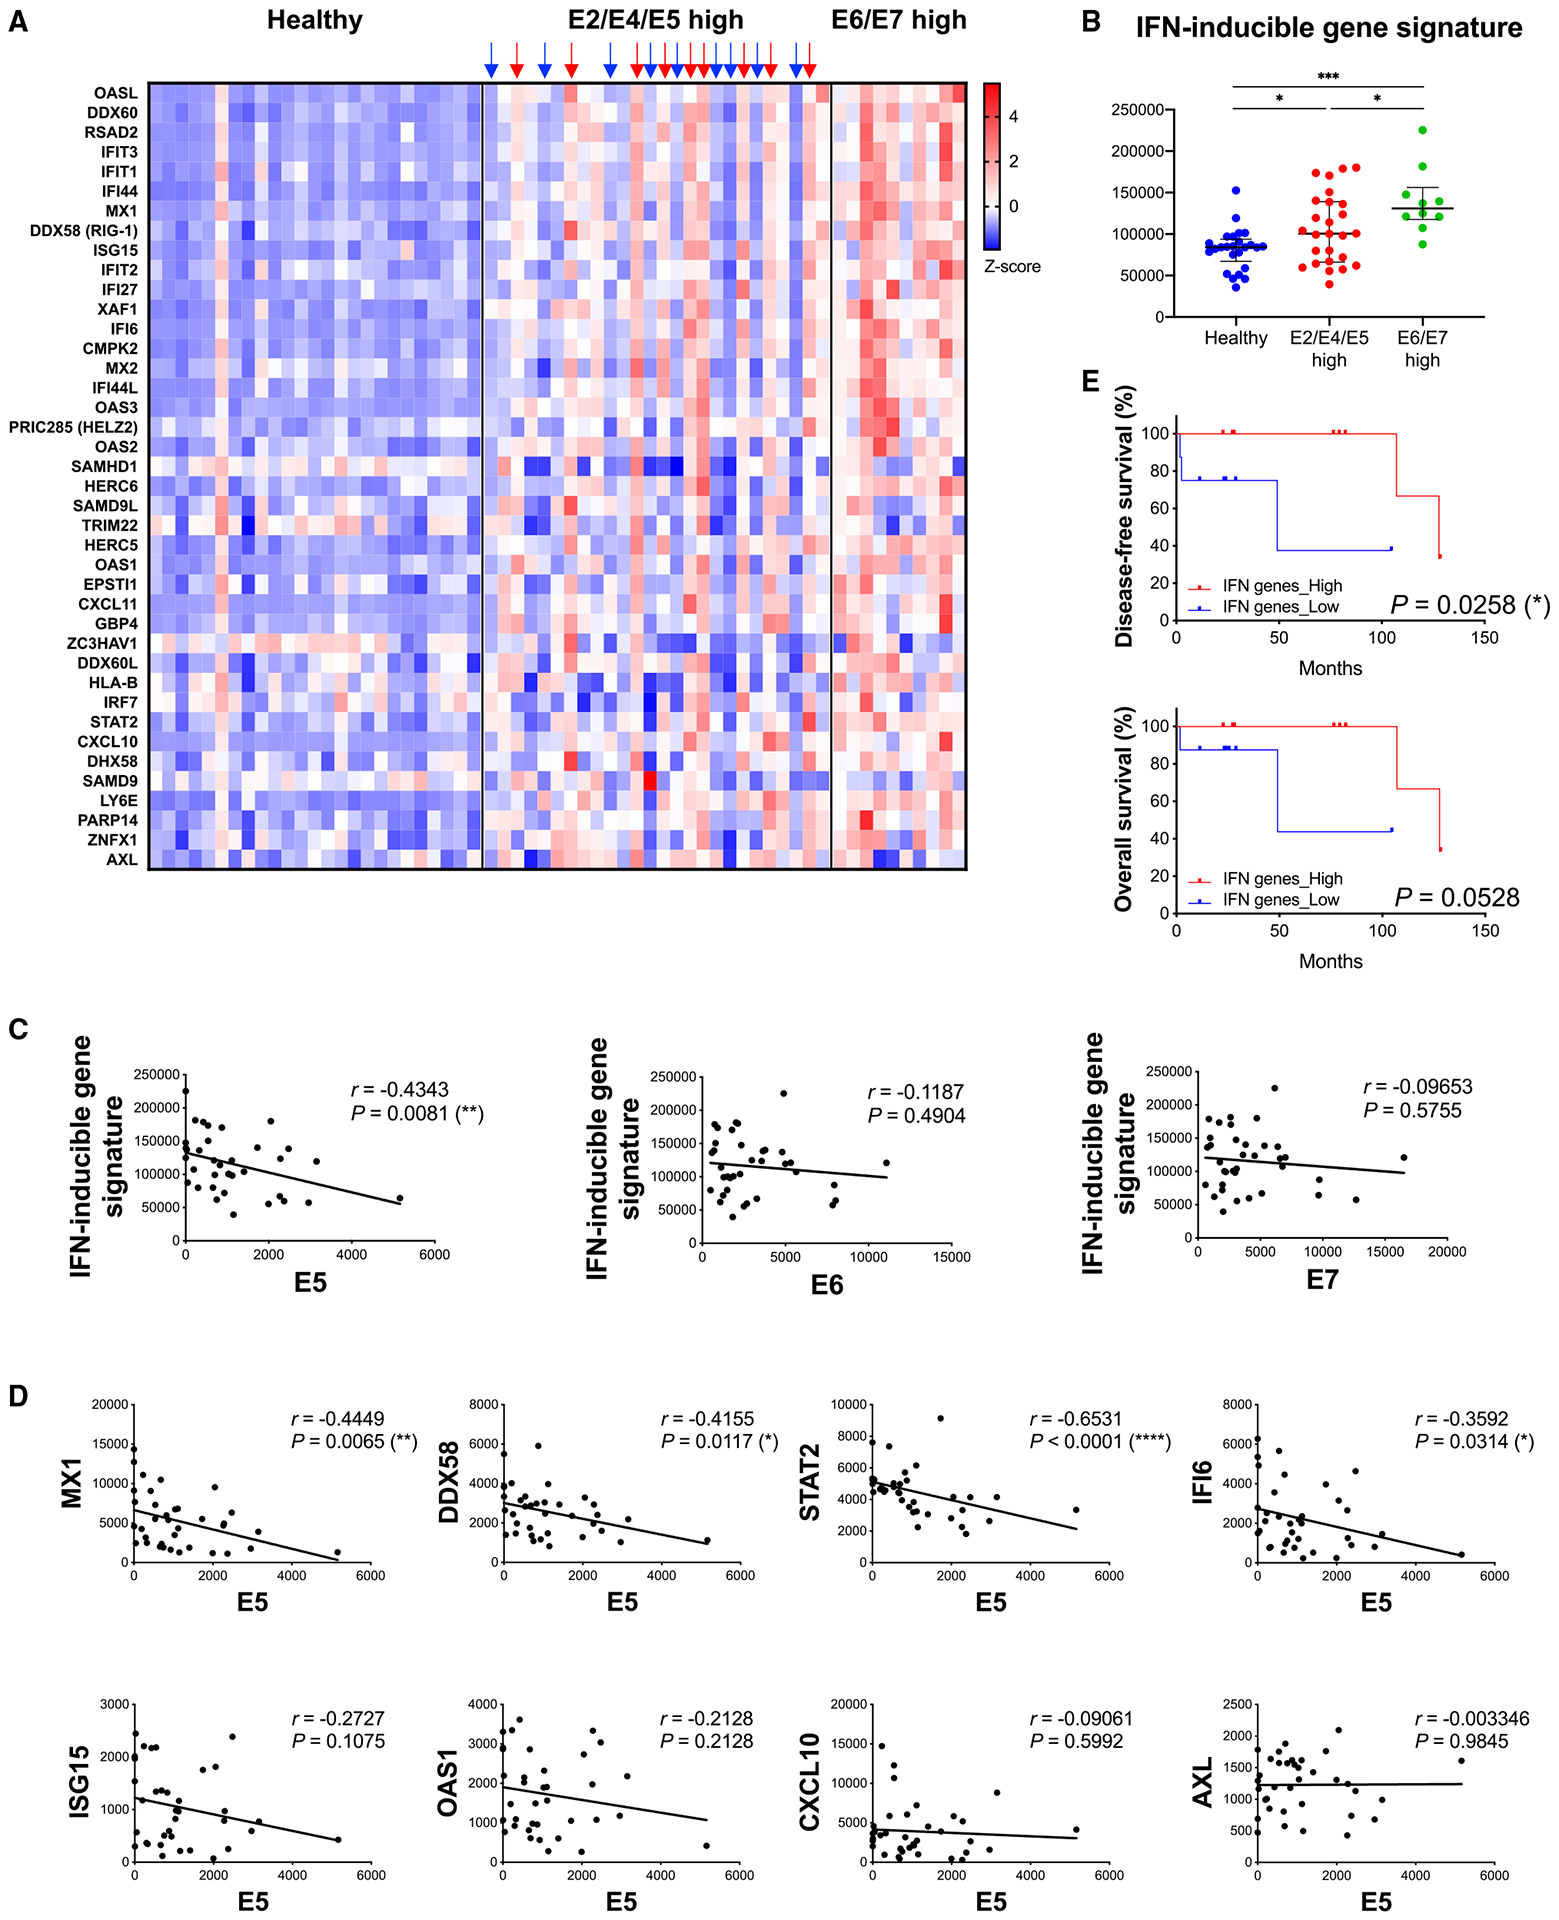
Figure 7. HPV E5 expression was inversely correlated with an IFN-inducible gene signature in the HNSCC patient cohort.

(A–E) JHU cohort of HNSCC patients.
(A) Heatmap of IFN-inducible gene expression analyzed by RNA-seq (normal, n = 25; E2/E4/E5 high, n = 26; E6/E7 high, n = 10).
(B) Expression of the IFN-inducible gene signature in each group. Median with interquartile range.
(C) Correlation analysis of HPV E5, E6, or E7 expression and IFN-inducible gene signature (n = 36, Spearman correlation coefficient).
(D) Correlation analysis of HPV E5 and selected genes from the IFN-inducible gene signature.
(E) Overall survival and disease-free survival of patients with high IFN-inducible gene expression (indicated by red arrows in Figure 7A) and low expression (indicated by blue arrows) from the E2/E4/E5 high group (n = 9 per group).
