Figure 3.
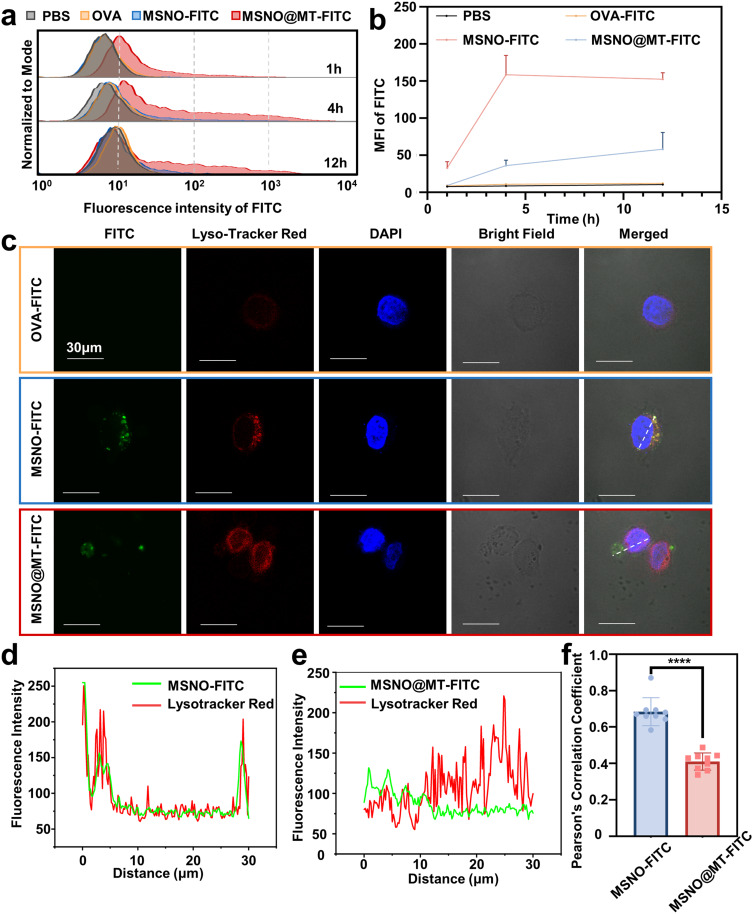
MSN@MT facilitates DC cellular uptake and lysosomal escape. (a) Representative histograms and (b). mean fluorescence intensity of flow cytometric analysis of DC2.4 cells co-cultured with OVA-FITC, MSNO-FITC, and MSNO@MT-FITC for 1, 4, and 12 hours (n = 3). (c). Representative confocal microscopy images of DC2.4 cells co-cultured with OVA-FITC, MSNO-FITC, and MSNO@MT-FITC for 6 hours. The colors represent OVA-FITC (green), nucleus (blue), lysosomes (red), and co-localization of OVA-FITC and lysosomes (yellow). (d) The relative fluorescence intensity of red and green fluorescence in the MSNO-FITC and (e) MSNO@MT-FITC groups, represented by the white dashed line in the CLSM image in (a), measured in ImageJ software. (f) Pearson’s correlation coefficient values of MSNO and MSNO@MT, measured in ImageJ (n = 9). The indicated groups were analyzed using one-way ANOVA. ****P < 0.0001.

