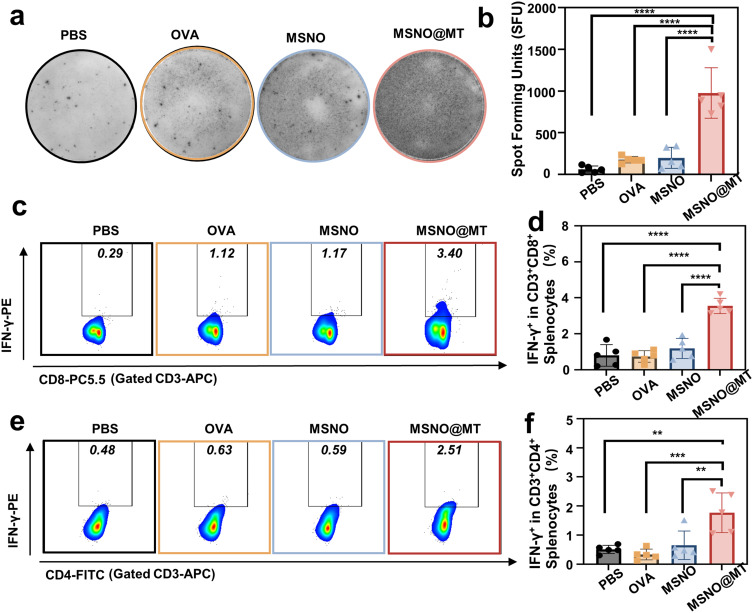
Figure 6.
MSN@MT induces specific T-cell immunity in mice. (a) Representative images and (b) data analysis of spleen cells measured using ELISPOT to detect cells producing IFN-γ spots upon restimulation. (c) Scatter plots and (d) data analysis showing the proportion of CD3+CD8+ cells secreting IFN-γ among spleen cells from immunized mice after in vitro restimulation. (e) Scatter plots and (f) data analysis depicting the proportion of CD3+CD4+ cells secreting IFN-γ among spleen cells from immunized mice after in vitro restimulation. The indicated groups were analyzed using one-way ANOVA. Significance levels are classified as **P < 0.01, ***P < 0.001, and ****P < 0.0001.

