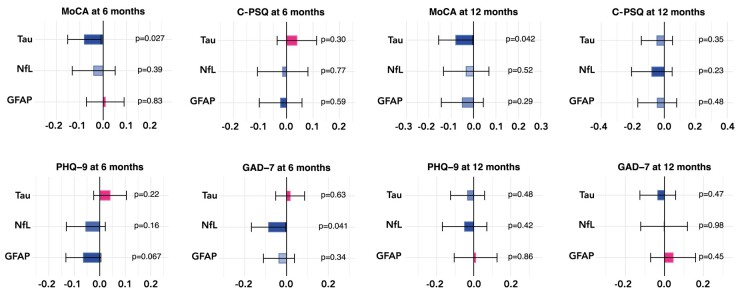
Figure 1.
Associations between markers of nervous system injury and post-acute neuropsychiatric features measured at 6 and 12 months. Each bar represents the number of SDs by which the neuropsychiatric scale varies when the level of the nervous system injury marker varies by 1 SD. The error bars indicate 95% CIs. Uncorrected P-values are reported next to each bar, and Bonferroni-corrected P-values meeting statistical significance thresholds are flagged as follows: *<0.05, **<0.01 and ***<0.001. See Supplementary Figs 2 and 3 for the same results based on different statistical models.

