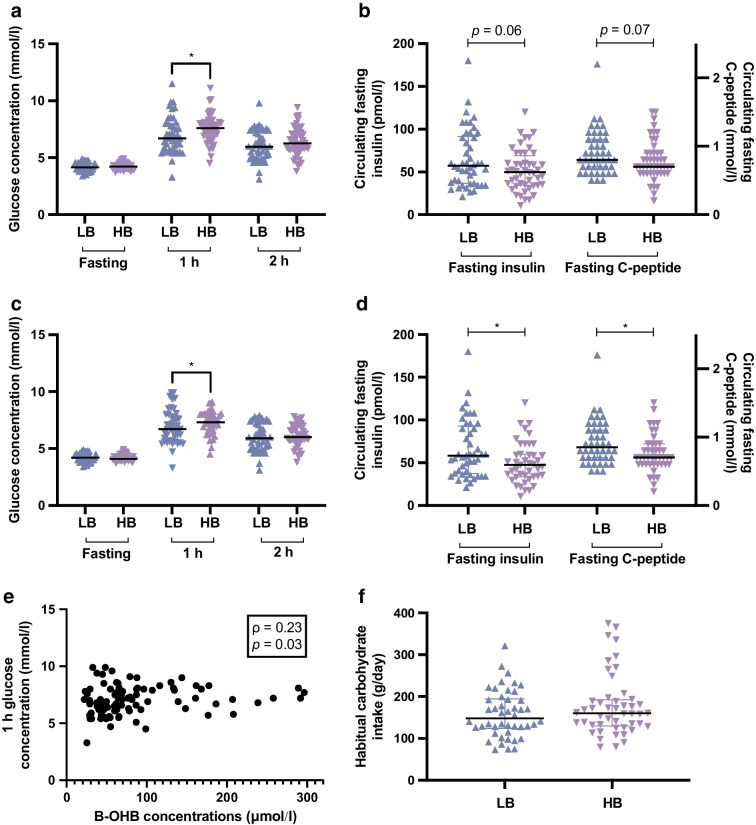
Fig. 2.
Differences in glucose and insulin between participants in the LB and HB groups. (a) Fasting, 1 h and 2 h glucose levels in the OGTT at 28 weeks’ gestation in participants in the LB and HB groups. (b) Fasting insulin and C-peptide levels before the OGTT at 28 weeks’ gestation in the LB and HB groups. (c, d) As in (a, b) but only including normoglycaemic participants. (e) Spearman correlation between B-OHB concentrations and glucose concentrations at 1 h in the OGTT. (f) Habitual carbohydrate intake between women in the LB and HB groups. Data presented as individual points, and with a line through the median in (a–d), *p<0.05

