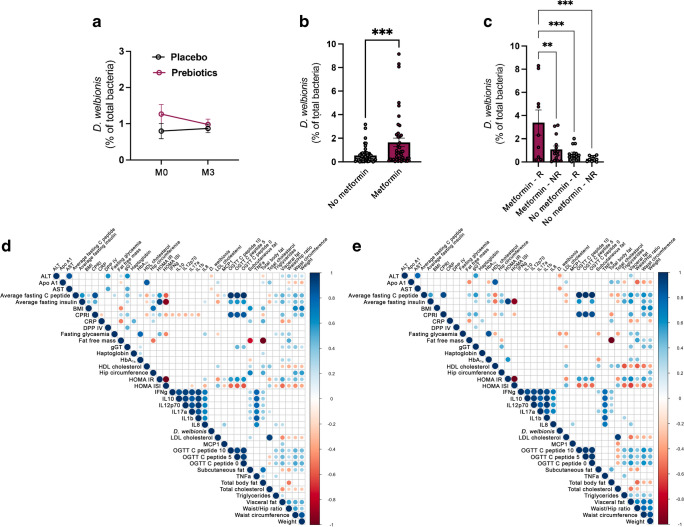
Fig. 1.
D. welbionis levels are not affected by prebiotics but are higher in metformin-treated individuals and responders. (a) Faecal D. welbionis levels (% of total bacteria) before (M0) and 3 months after (M3) supplementation with prebiotics or a placebo. (b) Faecal D. welbionis levels (% of total bacteria) at baseline in participants treated with metformin (metformin) or not (no metformin). (c) Faecal D. welbionis levels (% of total bacteria) at baseline in participants treated or not with metformin and responders (R) or non-responders (NR) to the prebiotic treatment for BMI decrease. (d) Correlation analysis between anthropometric and metabolic variables and D. welbionis measured in the gut microbiota of all individuals included in the cohort prior intervention (baseline, M0). (e) Correlation analysis between anthropometric and metabolic variables and D. welbionis measured in the gut microbiota of metformin-treated individuals included in the cohort prior intervention (baseline, M0). Results are presented as bar plots with mean±SEM for parts (a), (b) and (c). Data were analysed using unpaired t test for part (b) and one-way ANOVA followed by Tukey’s post hoc test for part (c). **p<0.01; ***p<0.001. For parts (d) and (e), the presence of a circle indicates that the correlation is significant, p<0.05 (Spearman’s correlation test). The circle size relates to the absolute value of correlation. The bigger the circle size, the higher the correlation. Blue indicates positive correlations and red negative correlations. Apo, apolipoprotein; CPRI, C-peptide to glucose ratio; CRP, C-reactive protein; DPP IV, dipeptidyl peptidase IV; gGT, γ-glutamyl transferase; MCP1, monocyte chemoattractant protein 1

