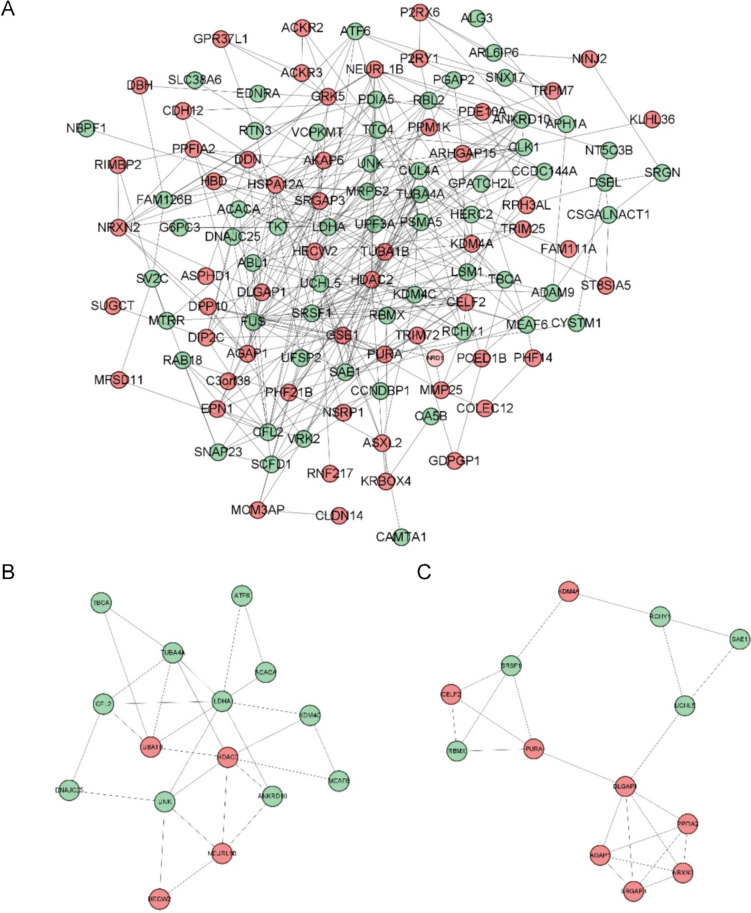
Fig. 3.
PPI analysis. (A) The PPI network of DEGs from the GSE135697 dataset. Disconnected nodes in the network are hidden; (B) module 1 (score: 4); (C) module 2 (score: 3.833); modules with an MCODE score >3 and nodes >5 were selected. PPI: protein-protein interaction; DEGs: differentially expressed genes. Green represents down-regulation, and red shows up-regulation

