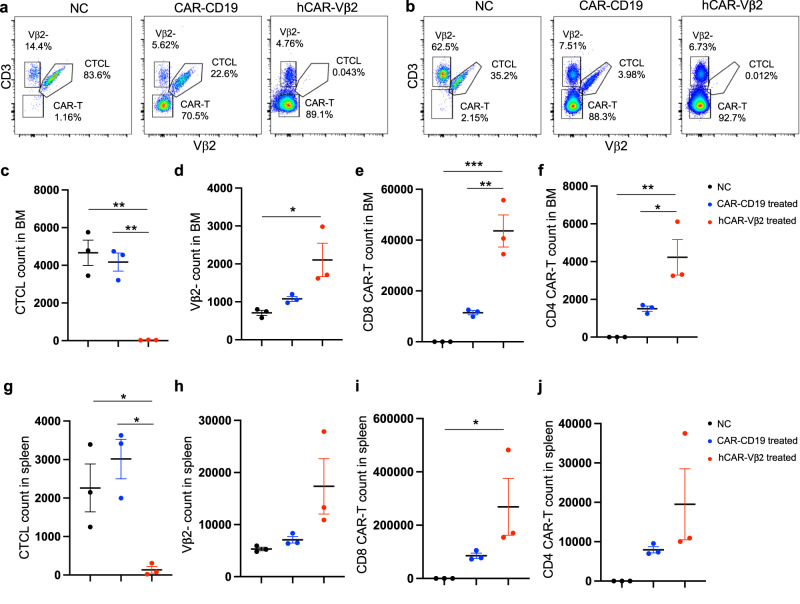
Fig. 3. Humanization of CAR-Vβ2 T cells with preserved efficacy.
a, b Representative flow cytometry of (a) BM and (b) spleen, showing CD3+ Vβ2+ CTCL cells, CD3+ Vβ2-negative normal T cells and CD3-negative hCAR-Vβ2 T cells 3 days after in vivo hCAR-Vβ2 treatment, nonspecific CAR-CD19 treatment, or no-treatment control (NC). c Vβ2+ CTCL cells (d) Vβ2-negative normal T cells (e) CD8 hCAR-T and (f) CD4 hCAR-T cells in NSG BM 3 days after in vivo allogeneic triple-KO hCAR-Vβ2 (red) or CAR-CD19 (blue) pan-T cell treatment generated from a healthy donor compared to no-treatment control (NC, black). g Vβ2+ CTCL cell counts (h) Vβ2-negative normal T cell counts (i) CD8 CAR-T cell counts and (j) CD4 CAR-T cell count in spleen of the same mice. c–j N = 3 mice per group. Data are presented as mean values +/− SEM. *p < 0.05, **p < 0.01 and ***p < 0.001 by one-way ANOVA. Source data and exact p-values are provided as a Source Data file.

