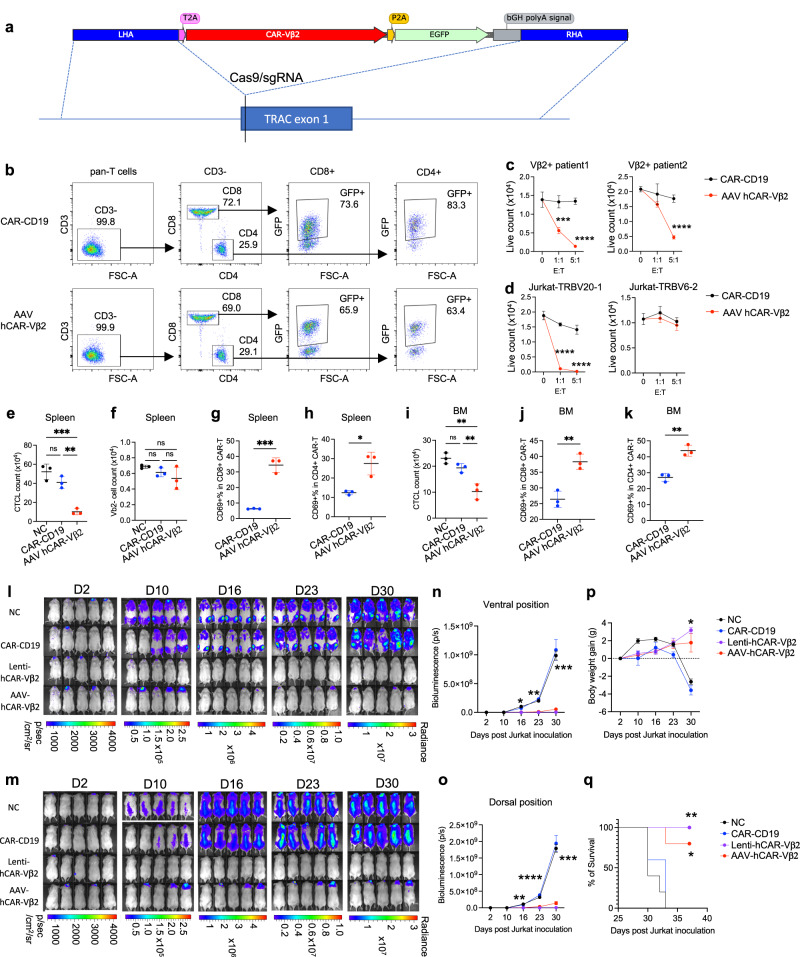
Fig. 4. CRISPR-AAV system for CAR-Vβ2 T cell generation and treatment of Vβ2+ PTCL PDX.
a Adeno-associated virus (AAV) chimeric antigen-receptor (CAR) template structure and the strategy to integrate into the TRAC region using Cas9-TRAC-sgRNA. b Representative flow cytometry showing CD3- purity, CD4 and CD8 population percentages and CAR expression of AAV-dependent allogeneic hCAR-Vβ2 T cells compared to lentiviral-dependent allogeneic CAR-CD19 T cells. c Live PTCL/CTCL cell counts from two Vβ2+ patients and (d) live Jurkat-TRBV20-1 (Vβ2+, left) or Jurkat-TRBV6-2 (Vβ13.2+, right) cell counts after overnight in vitro culture with allogeneic lenti-CAR-CD19 T cells (black) or AAV-hCAR-Vβ2 T cells (red) at different E:T ratios, determined by flow cytometry. e–k Total CD4 T cells isolated from a Vβ2+ PTCL patient were adoptively transferred into groups of NSG mice that were then treated with allogeneic triple-KO AAV-hCAR-Vβ2 (red) or lenti-CAR-CD19 (blue) generated from healthy donor pan T cells, compared to no-treatment control (NC, black). Three days post-treatment (e) Vβ2+ CTCL cells (f) Vβ2- normal T cells (g) CD69+ % in CD8 CAR-T cells, and (h) CD69+ % in CD4 CAR-T cells in spleen were quantified by flow cytometry, as were (i) Vβ2+ CTCL cells (j) CD69+ % in CD8 CAR-T cells, and (k) CD69+ % in CD4 CAR-T cells in BM. l–o Long-term bioluminescence monitoring (IVIS) of Jurkat-TRBV20-1-lucifer cell-bearing NSG mice, at (l–n) ventral or (m–o) dorsal position, without treatment (NC, black) or following treatment with CAR-CD19 T cells (blue), lenti-hCAR-Vβ2 T cells (purple) or AAV-hCAR-Vβ2 T cells (red). p, Body weight and (q) survival of the same mice. c, d n = 3 replicates in each group. ***p < 0.001 and ****p < 0.0001 by two-way ANOVA. e-k, n = 3 mice in each group. *p < 0.05, **p < 0.01 and ***p < 0.001 by one-way ANOVA. n–q n = 5 mice in each group. n, o *p < 0.05, **p < 0.01, ***p < 0.001 and ****p < 0.0001 by two-way ANOVA. q *p < 0.05 and **p < 0.01 by survival analysis (Kaplan-Meier). c–k–n–q Data are presented as mean values +/− SEM. All replicates are independent samples. Source data and exact p-values are provided as a Source Data file.

