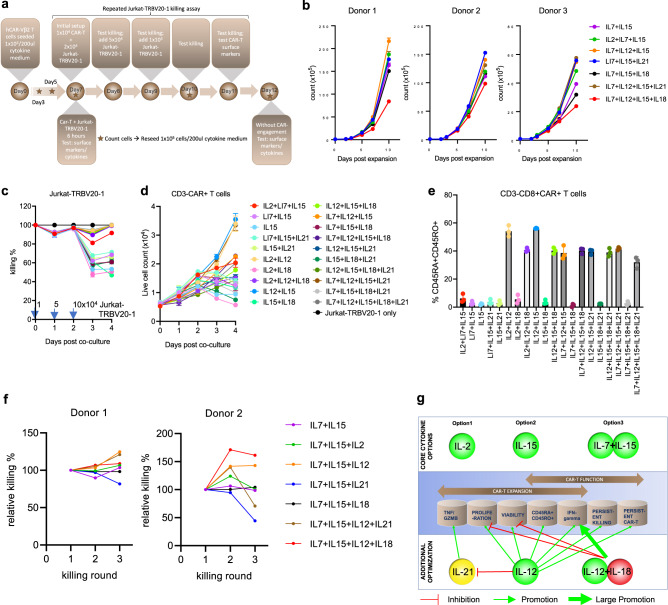
Fig. 5. Cytokine optimization for hCAR-Vβ2 T cell expansion in vitro.
a Schematic of the timeline of cytokine optimization and functional analysis. b Live total T cell counts during in vitro expansion of hCAR-Vβ2 T cells from three different donors, determined by trypan blue cell counting. c Jurkat-TRBV20-1 cell killing % and (d) live CD3- hCAR-Vβ2 T cell counts in acute repeated Jurkat-TRBV20-1 killing assay, determined by trypan blue cell counting and flow cytometry. e CD45RA+ CD45RO+ % of CD8 + CD3- hCAR-Vβ2 T cells 4 days post repeated Jurkat-TRBV20-1 cell killing assay, determined by flow cytometry. b–e N = 3 replicates in each group. Data are presented as mean values +/− SEM. f relative Jurkat-TRBV20-1 killing by chronically stimulated hCAR-Vβ2 T cells from two healthy donors generated in seven cytokine conditions, with each killing round normalized to the first round. g summary of optimized cytokine combinations for allogeneic hCAR-Vβ2 T cell expansion in vitro. Illustrations in Fig. 5a, g were created using Adobe Illustrator. All replicates are independent samples. Source data are provided as a Source Data file.

