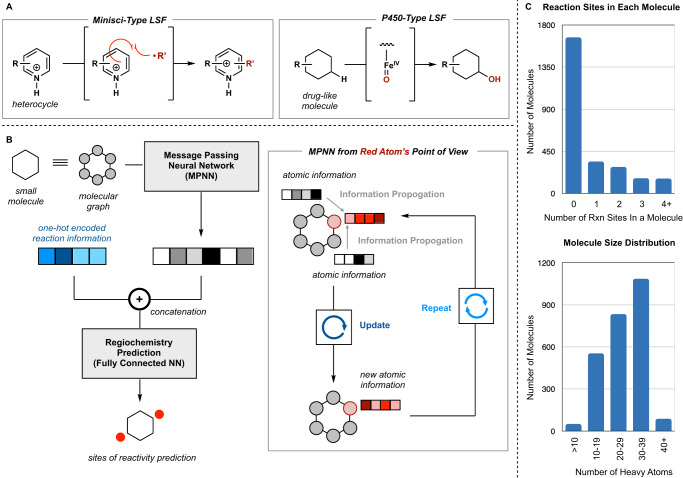
Fig. 1. Overview of the model framework, reactions modeled, and model dataset.
Source data for dataset breakdown is provided in the source data Excel file. LSF = late-stage functionalization, NN = neural network. A Mechanistic difference between the one-electron-based transformations of the two major types of reactions in the dataset: Minisci and P450. B Graphical overview of the basic message passing neural network (MPNN) model. Molecules are represented as graphs, to go through the MPNN, where atom information is propagated to its through-bond neighbors. The resulting embedded molecule (featurized molecule) is then concatenated with the one-hot encoded reaction information. This resulting vector is given to the final neural network to predict the probability of functionalization of each atom. C Distribution of reaction sites per molecule and molecule size in the dataset. The inclusion of negative data (0 reactive sites) was key to model performance. The majority of LSF molecules were between 20 and 40 heavy atoms (non-hydrogen atoms).

