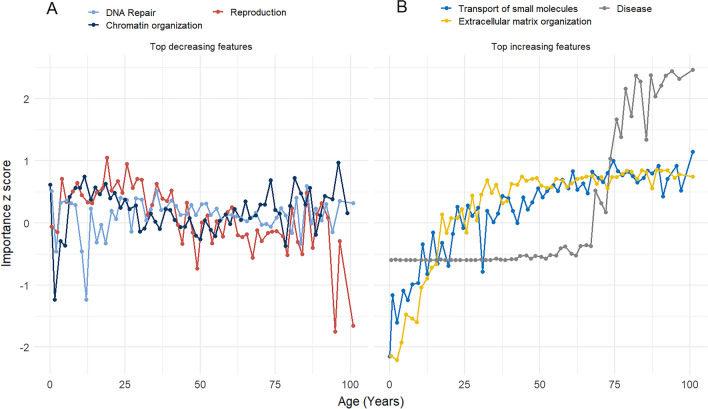
Figure 3.
Standardized importance score as a function of chronological age. We show the z-score based on the distribution of the importance scores for the neurons (features) in the last layer of the network (corresponding to the top level in the hierarchy of the ReactomeDB) with the largest change in the z-score across the chronological age. The top 3 features where the trend in the z-score is negative are displayed in (A), whereas the top 3 features where the z-score is increasing with age are shown in (B).

