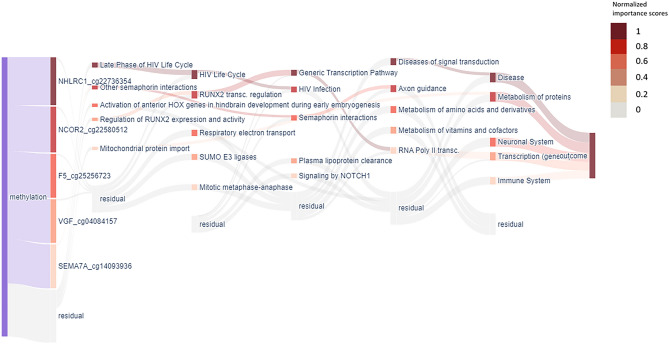
Figure 4.
Sankey diagram of the top features calculated across all the samples in the pan-tissue dataset. The visualization of XAI-AGE layer structure shows the normalized relative importance score difference between the old (>65 years) and young samples for various nodes inside each layer. Darker colours indicate a larger difference between the importance scores for the two age groups at the given node. Only the top 5 nodes in each layer are displayed here, where the other nodes are indicated by the single semi-transparent nodes (named residual) at the bottom for each layer.

