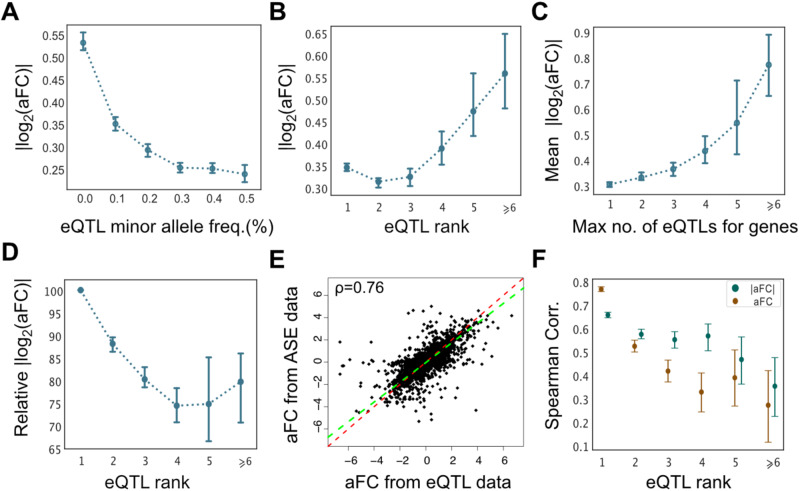
Fig. 2. Empirical properties of conditionally independent eQTL effect sizes.
The absolute effect size as a function of eQTL minor allele frequency (A) and the order at which it was identified for a gene (eQTL rank) (B) in adipose subcutaneous tissue. C Average eQTL effect size as a function of the total number of eQTLs associated with a gene. D The eQTL effect size relative to the average eQTL effect for a given gene as a function of the eQTL rank. (A–D n = 25,682). E The eQTL effect sizes as estimated by gene expression and population ASE data independently. The Deming regression fit is shown in green, and the red line is (y = x). F The correlation with the ASE data progressively decreased for secondary eQTLs (n = 25,682). Error bars represent 95% bootstrap confidence intervals of the median. The n value denotes the number of genes.

