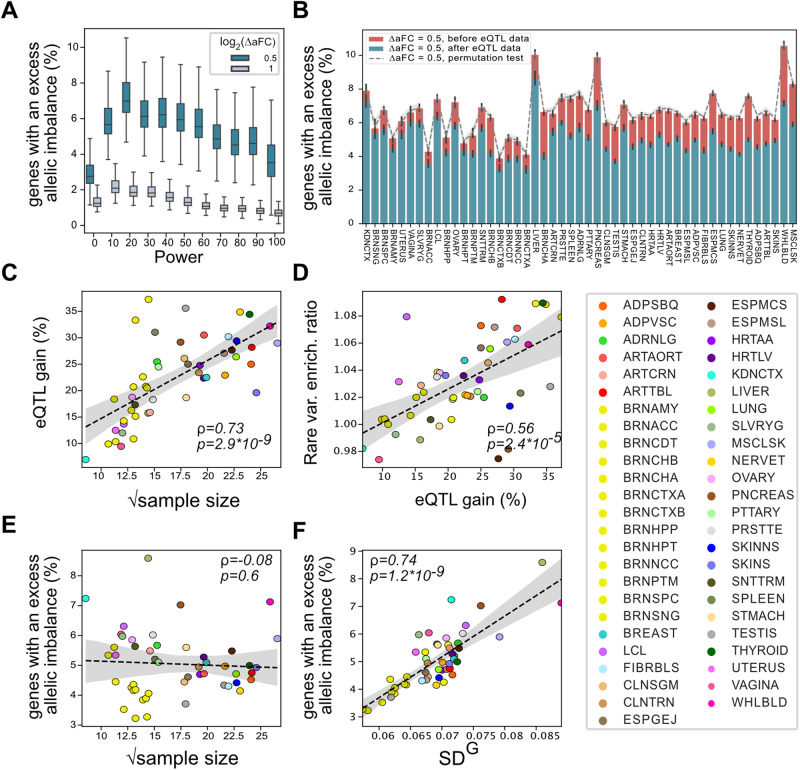
Fig. 4. Individual-level cis-regulatory landscape captured by eQTL data.
The percentage of genes with an excess allelic imbalance after accounting for known eQTLs as a function of power in adipose subcutaneous (A) (see Supplementary Data 2 for detailed statistics for each individual), and for genes with over 80% power across all tissue samples (B). Panel (B) shows the fraction of genes with half a fold excess allelic imbalance with the red bars representing the baseline case where no eQTL data is considered (see Supplementary Data 1, and 3 for tissue names and the number of samples/genes per tissue, respectively). The Error bars represent bootstrap 95% confidence intervals. C The relative decrease in the number of genes with excess allelic imbalance after incorporating eQTL data (eQTL gain) as a function of the tissue sample size. D Enrichment of rare variants (5% FDR) increased with the eQTL gain across tissues. E, F The proportion of genes with excess allelic imbalance after incorporating eQTL data (green bars in B) did not show correlation with the tissue sample size (E) but was highly correlated with the median expected genetic variation in gene expression in a given tissue. where VG is estimated by ANEVA15. For panels (C–F), linear regression fit is shown in black dashed line along with bootstrap 95% confidence intervals in gray shades. The ρ and p values represent the two-sided spearman correlation coefficient and associated p-value, respectively. Boxplot in (A) represent first quartile, median, and third quartiles. Whiskers represent Q1–1.5* interquartile range (IQR) and, Q3 + 1.5*IQR. Outliers are hidden for ease of viewing.

