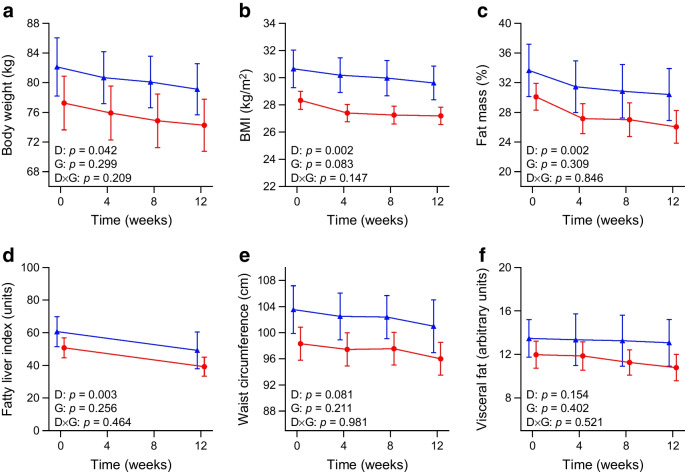
Fig. 1.
Changes in body weight (a), BMI (b), fat mass (c), fatty liver index (d), waist circumference (e) and visceral fat (f) in individuals with type 2 diabetes randomly assigned to a 12 week eTRC diet (red circles) or a Med diet (blue triangles) with matched energy restriction and macronutrient distribution. Data are mean ± SEM. Group differences were tested by two-way ANOVA for repeated measures including diet (D), group (G) and diet × group (D×G) interaction as factors

