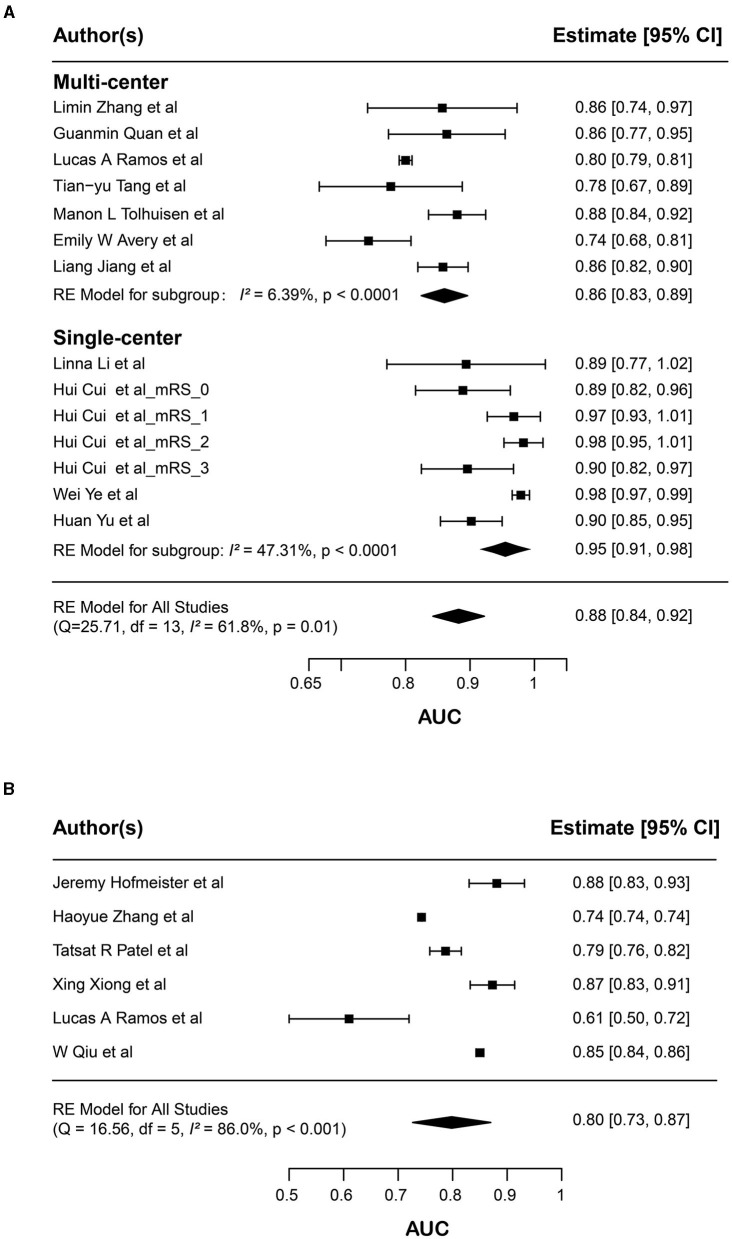
Figure 3.
Forest plots of the predictive performance of radiomics models. Forest plots showed the predictive performance of radiomics models in (A) long-term prognosis (mRS) and (B) immediate reperfusion (mTICI) of AIS patients. For long-term prognosis, the results of subgroup analysis according to single-center or multicenter factors are shown; Area under curve (AUC) for each study is presented as a black dot, with the horizontal line indicating the 95% confidence interval (CI). The pooled result for all studies is presented as a black diamond.

