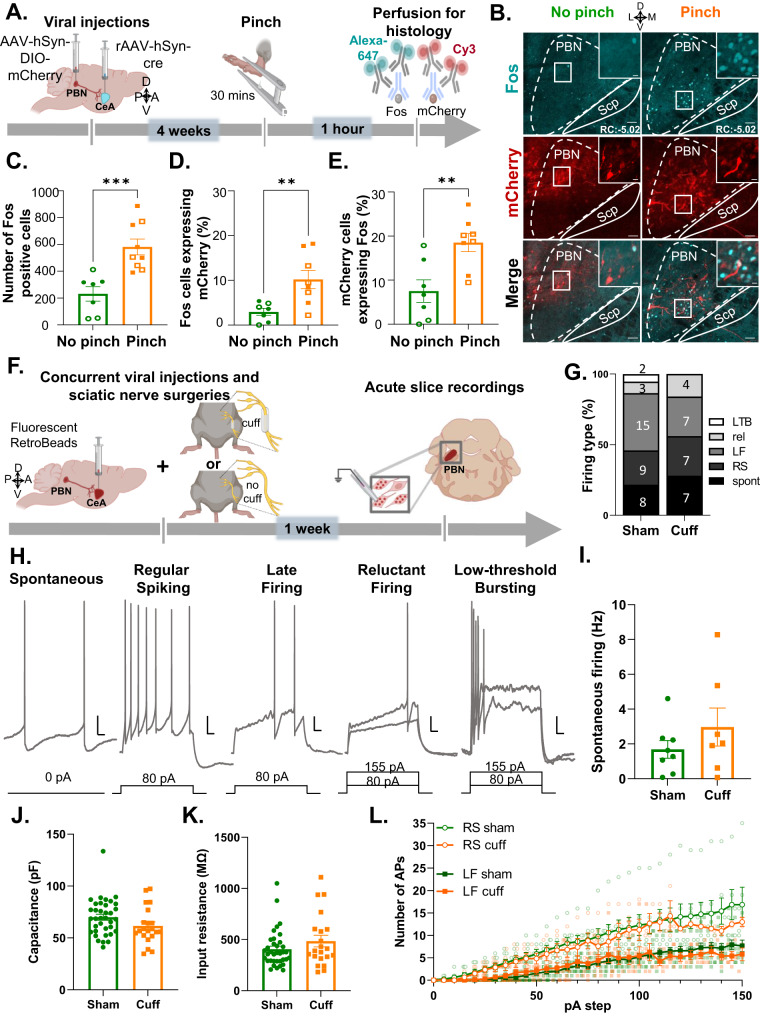
Fig. 2. Peripheral noxious stimulation induces Fos expression but intrinsic excitability is unaltered by nerve injury in CeA-projecting PBN neurons.
A Timeline of experiments. Male and female C57BL/6J mice were stereotaxically injected with AAV8-hSyn-DIO-mCherry into the right PBN and AAV.hSyn.HI.eGFP-Cre into the right CeA. Four weeks after viral injections, we performed bilateral pinch stimulation on the hind paws for 30 min followed by transcardial perfusion for histology. B Representative images of right PBN slices immunostained for mCherry and Fos (cyan). No-pinch (left) and pinch (right) panels show low magnification images of Fos (top) and mCherry (middle). High magnification images of merged signals in area delineated by white box are shown in the right panel. Scale bars represent 200 µm for low magnification and 25 µm for high magnification images. Solid arrows represent cells co-labeled with mCherry and Fos while open arrows show Fos only positive cells. Rostro-caudal level relative to bregma (RC) \for both animals is −4.96. C Fos+ cells of control (no pinch) vs experimental (pinch) mice in the PBN. n = 7 no-pinch mice (3 female and 4 male) and n = 9 pinch mice (4 female and 5 male); number of Fos positive cells represents the sum of positive cells in a total of 4 slices from the right PBN (RC levels: −4.96, −5.02, −5.20, −5.34 relative to bregma) per mouse. D Percentage of mCherry cells co-labeled with Fos in the PBN of pinch vs no-pinch mice. E Percentage of Fos+ cells co-labeled with mCherry in the PBN of pinch vs no-pinch mice. n = 7 mice for no-pinch (3 female and 4 male) and n = 8 mice for pinch (4 female and 4 male). Unpaired two tailed t test; **p < 0.01; ***p < 0.001. Individual mice are represented by scatter points and open symbols represent female mice. All data is presented as means ± SEM. F Experimental timeline. Male C57BL/6J mice were concurrently stereotaxically injected with retrobeads into the CeA and implanted with a sciatic nerve cuff. Slice electrophysiology experiments were done 7–10 days after surgery. G Relative proportion of firing types was not different between pain groups. Digits inside bars represent the number of cells per firing type. Scale bars represent 10 mV and 50 ms for vertical and horizontal scales, respectively. H Firing types of CeA-projecting PBN neurons include: spontaneously-firing (spont), regular spiking (RS), late firing (LF), reluctant (rel) and low-threshold bursting (LTB) neurons. Spontaneous firing frequencies (I) Capacitance (J), input resistance (K), and evoked repetitive firing (L) are not significantly different between neurons from sham (n = 36 cells from 14 mice) and cuff (n = 19–20 cells from 12 mice) mice. Unpaired t test (I–K) and mixed-effects model (REML) with matching (L).

