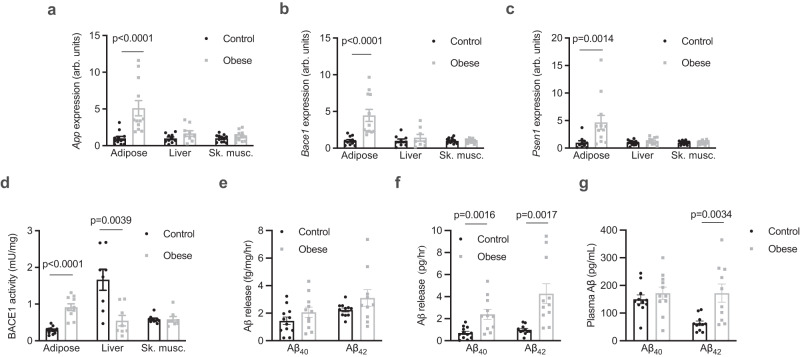
Fig. 1. Ab42 is released from adipose tissue, which is increased in obesity.
a App expression in adipose tissue (Mann Whitney test, U = 6; n = 12/group), the liver (n = 10 and 9/group respectively) and skeletal muscle (Sk. musc., quadriceps; unpaired t-tests; n = 12/group) from control and obese mice. b Bace1 expression in adipose tissue (Mann Whitney test, U = 1; n = 12/group), the liver (n = 9 and 8/group, respectively) and sk. musc. (unpaired t-tests; n = 12/group) from control and obese mice. c, Psen1 expression in adipose tissue (Mann Whitney test, U = 14; n = 10 and 12/group respectively), the liver (n = 12/group) and sk. musc. (n = 12/group) from control and obese mice (unpaired t-tests). d BACE1 activity in adipose tissue (n = 12 and 10/group respectively), the liver (n = 8/group) and sk. musc. (n = 8/group) from control and obese mice (unpaired t-tests). e relative release of Aβ isoforms from adipose tissue of control and obese mice normalised for tissue weight. f absolute release of Aβ isoforms from adipose tissue of control (n = 12) and obese (n = 11) mice (Mann Whitney test, U = 6). g plasma Aβ isoforms in control (n = 12) and obese (n = 11) mice (unpaired t-test). All data are mean ± SEM. Statistical tests are two-tailed. Source data are provided in the Source Data file.

