. 2023 Nov 6;84(2):258–275. doi: 10.1158/0008-5472.CAN-23-1448

Figure 2.

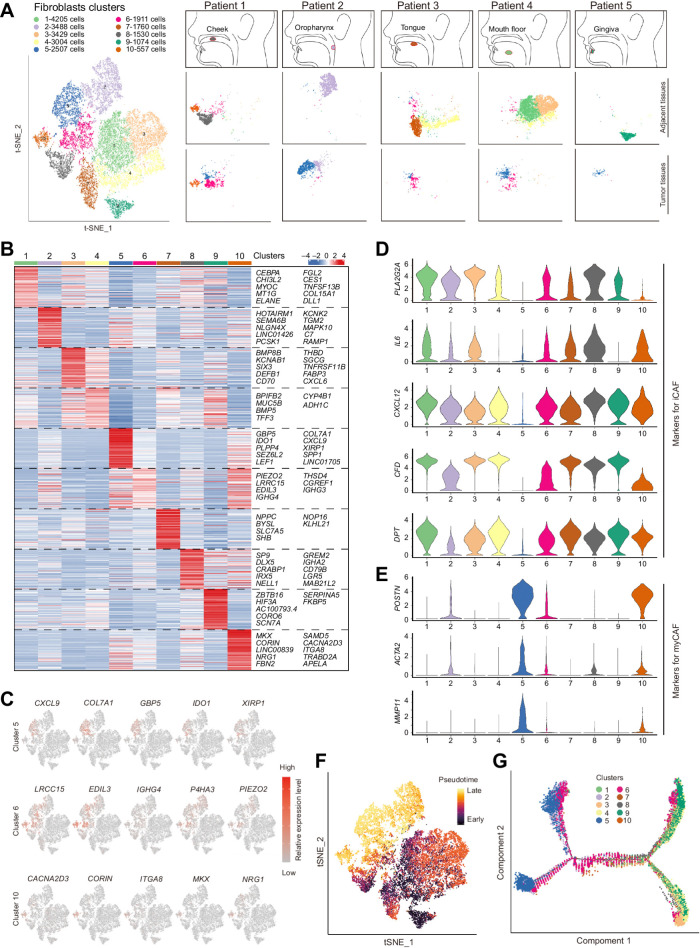
Figure 2. Global analysis of fibroblasts from tumoral and adjacent tissues of HNSCC. A, Clinical information of collected tumoral and adjacent samples for single-cell RNA sequencing and each sample's t-SNE plot results for fibroblasts. B, Heat map of markers for 10 clusters of fibroblasts. The rank of the gene markers is accessed with “findmarker” algorithm. C, The expression of the top 5 markers for CAFs (clusters 5, 6, and 10) were overlaid in the t-SNE plots and also indicated in the violin plots. D and E, Violin plots of gene expression for iCAF- (D) or myCAF (E)-associated genes in fibroblasts. F and G, Pseudotime analysis for fibroblasts. F, Cells were labeled with the pseudodifferentiation time in the t-SNE plots. G, Cells labeled according to different clusters were also assigned to different pseudotime trajectories.

Global analysis of fibroblasts from tumoral and adjacent tissues of HNSCC. A, Clinical information of collected tumoral and adjacent samples for single-cell RNA sequencing and each sample's t-SNE plot results for fibroblasts. B, Heat map of markers for 10 clusters of fibroblasts. The rank of the gene markers is accessed with “findmarker” algorithm. C, The expression of the top 5 markers for CAFs (clusters 5, 6, and 10) were overlaid in the t-SNE plots and also indicated in the violin plots. D and E, Violin plots of gene expression for iCAF- (D) or myCAF (E)-associated genes in fibroblasts. F and G, Pseudotime analysis for fibroblasts. F, Cells were labeled with the pseudodifferentiation time in the t-SNE plots. G, Cells labeled according to different clusters were also assigned to different pseudotime trajectories.