. 2023 Nov 6;84(2):258–275. doi: 10.1158/0008-5472.CAN-23-1448

Figure 3.

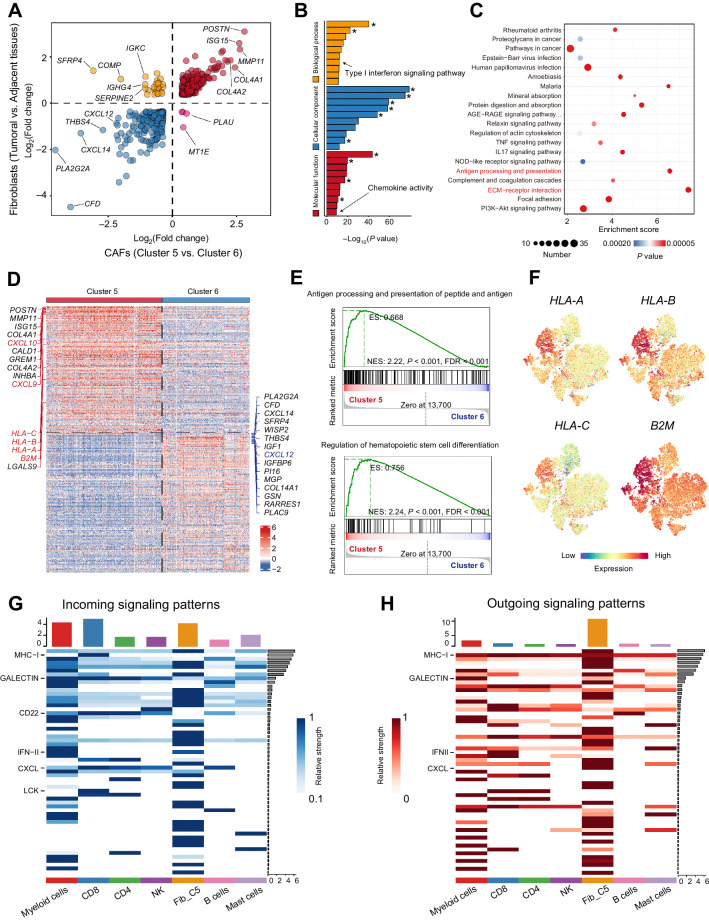
Figure 3. High expression levels of CXCLs and MHC class I molecules linked cluster 5 CAFs and CD8+ T cells. A, Plots of DEGs (fold change >1) between fibroblasts from tumoral and adjacent tissues and between clusters 5 and 6 CAFs. B and C, Gene ontology analysis (B) and GSEA (C) for expression differences between fibroblasts from tumoral and adjacent tissues. Asterisk (*), terms related to extracellular matrix or collagen. D–F, Expression difference between two CAF clusters (clusters 5 and 6). D, Heat map of top DEGs between cluster 5 and cluster 6 CAFs. E, GSEA analysis of DEGs between clusters 5 and 6 in the terms of “Antigen processing and presentation of peptide antigen via MHC class I” and “Regulation of hemataopoietic stem cell differentiation.” F, MHC class I molecules (HLA-A, HLA-B, HLA-C, and B2M) expression in the t-SNE plots of fibroblasts. G and H, Cell interaction analysis of cluster 5 CAFs and immune cells in HNSCC.

High expression levels of CXCLs and MHC class I molecules linked cluster 5 CAFs and CD8+ T cells. A, Plots of DEGs (fold change >1) between fibroblasts from tumoral and adjacent tissues and between clusters 5 and 6 CAFs. B and C, Gene ontology analysis (B) and GSEA (C) for expression differences between fibroblasts from tumoral and adjacent tissues. Asterisk (*), terms related to extracellular matrix or collagen. D–F, Expression difference between two CAF clusters (clusters 5 and 6). D, Heat map of top DEGs between cluster 5 and cluster 6 CAFs. E, GSEA analysis of DEGs between clusters 5 and 6 in the terms of “Antigen processing and presentation of peptide antigen via MHC class I” and “Regulation of hemataopoietic stem cell differentiation.” F, MHC class I molecules (HLA-A, HLA-B, HLA-C, and B2M) expression in the t-SNE plots of fibroblasts. G and H, Cell interaction analysis of cluster 5 CAFs and immune cells in HNSCC.